

Volume 14, Issue 1 (Winter 2026)
PCP 2026, 14(1): 1-10 |
Back to browse issues page


Download citation:
BibTeX | RIS | EndNote | Medlars | ProCite | Reference Manager | RefWorks
Send citation to:


BibTeX | RIS | EndNote | Medlars | ProCite | Reference Manager | RefWorks
Send citation to:
Parhizgar N, Khabir L, Samani S, Hooman F. Psychometric Evaluation and Standardization of the Persian Adaptation of the APGAR Questionnaire Among Adults. PCP 2026; 14 (1) :1-10
URL: http://jpcp.uswr.ac.ir/article-1-1042-en.html
URL: http://jpcp.uswr.ac.ir/article-1-1042-en.html


1- Department of Psychology, Shi. C., Islamic Azad University, Shiraz, Iran.
2- Department of Psychology, Shi. C., Islamic Azad University, Shiraz, Iran. ,Leila.khabir@iau.ac.ir
2- Department of Psychology, Shi. C., Islamic Azad University, Shiraz, Iran. ,
Keywords: Adaptability, partnership, growth, affection, resolve (APGAR) scale, Family functioning, Family relationships, Validity, Reliability
Full-Text [PDF 747 kb]
(311 Downloads)
| Abstract (HTML) (856 Views)
Full-Text: (196 Views)
Introduction
Family functioning is a cornerstone of psychological resilience and well-being. This observation indicates that family-level interventions are pivotal in both preventing and mitigating mental disorders throughout life. Considering that mental disorders are among the major challenges in public health and affect at least one in every four individuals, family-based interventions can not only help improve individual mental health but also strengthen and maintain the overall mental health of the family system (Marth et al., 2022).
A substantial body of research indicates that the quality of family functioning exerts a profound influence on the psychological well-being of individual family members. Families that exhibit cohesion, emotional support, and effective communication generally experience better mental health outcomes among their members (Lin et al., 2022). According to the multi-level systems theory of the family, the family’s internal dynamics not only shape its structural balance but also critically inform the psychological and behavioral trajectories of its members (Cook & Kenny, 2006).
To date, several instruments have been designed to assess family functioning.
The 5-item family adaptability, partnership, growth, affection, resolve (APGAR), developed by Smilkstein, provides a unidimensional measure of family functioning with strong legacy support across age ranges (Smilkstein et al., 1982; Duarte & Cianciarullo, 2002; Santos & Pavarini, 2012; Smilkstein, 1978; Torres et al., 2009). The utilization of this tool enables the identification of dysfunctional elements within the family system, thereby paving the way for implementing effective interventions aimed at restoring balance to family relationships (Silva et al., 2014).
Cross-cultural studies in diverse settings (e.g. Latin America, East Asia) underscore the need for localized psychometric evaluation (Sh et al., 2009). For instance, the reliability and validity of the translated version of this questionnaire have been thoroughly assessed by Brazilian researchers in (Silva et al., 2014), Vietnam (Trung et al., 2024), Peru (Castilla et al., 2014), Korea (Kang et al., 1984), Indonesia (Ridwan et al., 2023), and Taiwan (Tsai & Sun, 2013). In Iran, a study sought to investigate the measurement properties of the aforementioned questionnaire in individuals aged 60 and above. Although the family APGAR scale has demonstrated robust psychometric properties in older geriatric populations in Iran (Karimi et al., 2022), its applicability to younger and middle-aged adults remains underexplored. Given that family dynamics and perceived support can vary significantly across the lifespan—particularly during adulthood when individuals often navigate complex roles as partners, parents, and caregivers—validating the scale in this demographic is both timely and essential. This study addresses a critical gap by evaluating the scale’s reliability and construct validity in a general adult sample, thereby extending its utility beyond geriatric contexts and enhancing its relevance for broader mental health screening and family-based interventions.
Materials and Methods
This study employed a cross-sectional design to examine the psychometric robustness of the family APGAR questionnaire, focusing on its validity and reliability, from June to July 2025. In this investigation, content validity, face validity, construct validity via confirmatory factor analysis, convergent validity, criterion validity, and the instrument’s reliability were assessed.
Participants voluntarily consented to take part in the study after receiving comprehensive information regarding its objectives. The study population comprised adult residents (over 18 years old) of Tehran City, Iran. Convenience sampling yielded a total of 424 participants for inclusion in the study. Eligibility for participation required being Iranian, 18 years or older, literate in Persian, and free from any clinically diagnosed psychiatric disorder. Participants who did not complete the questionnaires or did not meet the eligibility criteria were excluded from the final analysis. A preliminary pilot test was conducted with 30 participants to evaluate the comprehensibility and procedural integrity of the survey materials.
The instruments employed in the present study included the APGAR scale and the family organized cohesion scale (FOCS). Originally developed by Smilkstein in 1978, the family APGAR scale has shown satisfactory reliability, with Cronbach α values reported between 0.8 and 0.86. The scale comprises five items that assess family functioning across five principal domains. Responses are recorded on a three-point Likert scale, whereby participants express their agreement or disagreement with each item (0=seldom, 1=sometimes, 2=almost always). The resulting scores reflect family functioning as follows: a score between 8 and 10 signifies a family with optimal functioning and high cohesion; a score between 4 and 7 indicates moderate and somewhat suboptimal functioning; and a score between 0 and 3 denotes a family with poor functioning and low cohesion (Smilkstein, 1978; Smilkstein et al., 1982).
Furthermore, criterion validity was assessed through the correlation analysis between scores obtained from the APGAR scale and those from the FOCS. This latter instrument is a self-report questionnaire consisting of 13 items and four subscales—cohesion, sharedness, leadership clarity, and rule clarity. Responses are recorded using a 6-point Likert scale (1=strongly disagree to 6=strongly agree), with reverse scoring applied to items 2, 4, and 9. The score range of this scale is between 13 and 78; elevated scores reflect an increased level of family cohesion. Fisher et al. yielded a coefficient of 0.78, as measured by the Cronbach α, while in Iran, its internal consistency was calculated at 0.87 (Fisher et al., 1992).
Framework for the translation and cultural adaptation of the APGAR instrument
Using the forward-backward translation approach, the questionnaire was rendered into Persian. The initial translation was conducted independently by two bilingual experts. In the subsequent step of the procedure, the two translated versions were merged and revised. Together with the two translators, the translated version was then examined for its clarity, adherence to commonly used language, conceptual consistency with the original, and overall translation quality. Then, the Persian translation underwent back-translation into English by two independent translators who had not been involved in the initial translation phase. Finally, the original and the back-translated versions were compared in terms of conceptual equivalence. Following expert review and reconciliation, the final Persian translation of the questionnaire was endorsed for use.
Face validity
To determine the face validity of the instrument, 30 individuals with demographic characteristics similar to those of the target population completed the questionnaire. The item impact score was employed to evaluate face validity quantitatively. The Equation 1 was applied to compute the item impact score:
1. Item Impact Score=Frequency (%)×Importance
In this method, the perceived appropriateness of each item was evaluated by participants through a 5-point Likert scale, ranging from 1 (completely unsuitable) to 5 (completely suitable). If the item’s impact score exceeds 1.5, the item is considered appropriate for further analyses (Saneii et al., 2020). In this context, “frequency” refers to the total number of participants who evaluated the item as either ‘suitable’ or ‘completely suitable’ (i.e. ratings of 4 or 5). This value was used to compute face validity, expressed as the ratio of favorable ratings (4 or 5) to the total number of respondents. “Importance” is represented by the mean of all responses (Hardesty & Bearden, 2004). Additionally, 30 participants from the pilot test engaged in structured face-to-face interviews to facilitate the evaluation of qualitative face validity. Participants evaluated each item with respect to its relevance to the subject, clarity, readability, simplicity, and comprehensibility.
Content validity
The content validity ratio (CVR) and the content validity index (CVI) were established to determine the instrument’s content validity based on the evaluations provided by 8 psychologists (Shi et al., 2012; Zamanzadeh et al., 2015).
The CVI is computed using two methods: the item-level CVI (I-CVI) and the scale-level CVI (S-CVI) (Lawshe, 1975). I-CVI is determined as the proportion of experts assigning a ‘highly relevant’ rating to a given item, relative to the total number of evaluators, producing a value within the 0–1 range. According to established criteria, an I-CVI greater than 0.79 reflects adequate relevance, a score between 0.70 and 0.79 denotes the need for revision, and a score under 0.70 warrants item removal.
Determination of the S-CVI relies on the count of items within the questionnaire that were assigned a ‘highly relevant’ rating. Its calculation is typically performed using two widely adopted methods, the universal agreement method (S-CVI/UA) and the average CVI method (S-CVI/Ave). S-CVI/UA represents the ratio of items unanimously rated as relevant (I-CVI=1) to the total number of questionnaire items. Conversely, S-CVI/Ave is derived by summing the I-CVI scores for all items and dividing this total by the overall number of items (Zamanzadeh et al., 2015). Thresholds of ≥0.8 for S-CVI/UA and ≥0.9 for S-CVI/Ave are indicative of favorable content validity (Shi et al., 2012).
To compute the CVR, the necessity and importance of each item were evaluated on a three-point Likert scale by eight psychologists (Yamada et al., 2010). CVR scores range between -1 and +1, with higher scores indicating a greater degree of expert consensus. To compute the CVR, the Equation 2 is applied:
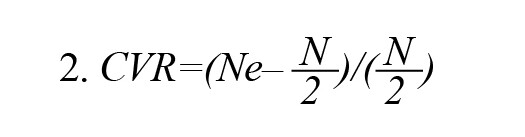
“Ne” corresponds to the count of experts identifying the item as “essential,” and N signifies the overall number of expert panel members. According to Lawshe’s critical values (Lawshe, 1975), a CVR exceeding 0.75 for eight specialists is acceptable and indicates that the item is appropriate for inclusion in the questionnaire.
Criterion validity
To assess criterion validity, the correlation between the total scores of the APGAR questionnaire and those obtained from the FOCS was examined. It was anticipated that the Family APGAR would have a positive and significant relationship with this scale. In this analysis, A Pearson r value equal to or exceeding 0.40 was deemed indicative as satisfactory, thereby indicating adequate validity of the instrument in measuring constructs related to family functioning.
Construct validity
Confirmatory factor analysis (CFA) was conducted to examine the construct validity. Average variance extracted (AVE) and composite reliability (CR) were utilized as key measures in evaluating convergent validity and overall construct reliability. For convergent validity to be established, all factor loadings must exceed 0.6 and be statistically significant. Furthermore, the AVE should be higher than 0.5, and the CR should exceed 0.6, thereby confirming that the construct demonstrates satisfactory reliability (Awang, 2015).
To evaluate the model fitness in the CFA, various fit indices were employed. Excluding the non-significance requirement of the P associated with the chi-square statistic—typically not applicable for large samples (i.e. >200)—the other indices and their minimum acceptable values were as follows (Awang, 2015): the root mean square error of approximation (RMSEA) should be <0.08; the comparative fit index (CFI), the goodness-of-fit index (GFI), Tucker-Lewis index (TLI), normed fit index (NFI), and the adjusted goodness-of-fit index (AGFI) should each exceed 0.9; and χ2/df should be <3.
Reliability
The reliability of the questionnaire was computed via the Cronbach α, which is deemed satisfactory if it exceeds 0.7. Additionally, scale stability was assessed through the test re-test procedure. For this purpose, a pilot test was conducted on 30 individuals possessing demographic characteristics similar to those of the target population. After a two-week interval, the participants completed the questionnaire again under identical conditions. The two administrations were then compared using the intraclass correlation coefficient (ICC), yielding an ICC above 0.8, indicating a desirable level of stability for the instrument (Nunnally, 1978).
To analyze the inter-item correlation, if an item yields a correlation coefficient greater than 0.30, it is retained within the questionnaire, as this indicates sufficient association with the instrument’s overall construct (Ridwan et al., 2023).
Statistical analysis
SPSS software, version 27 and AMOS software, version 24, both from IBM Corp., were utilized for data analysis. For descriptive analysis, quantitative variables were presented as Mean±SD, and categorical variables as frequency and percentage.
Results
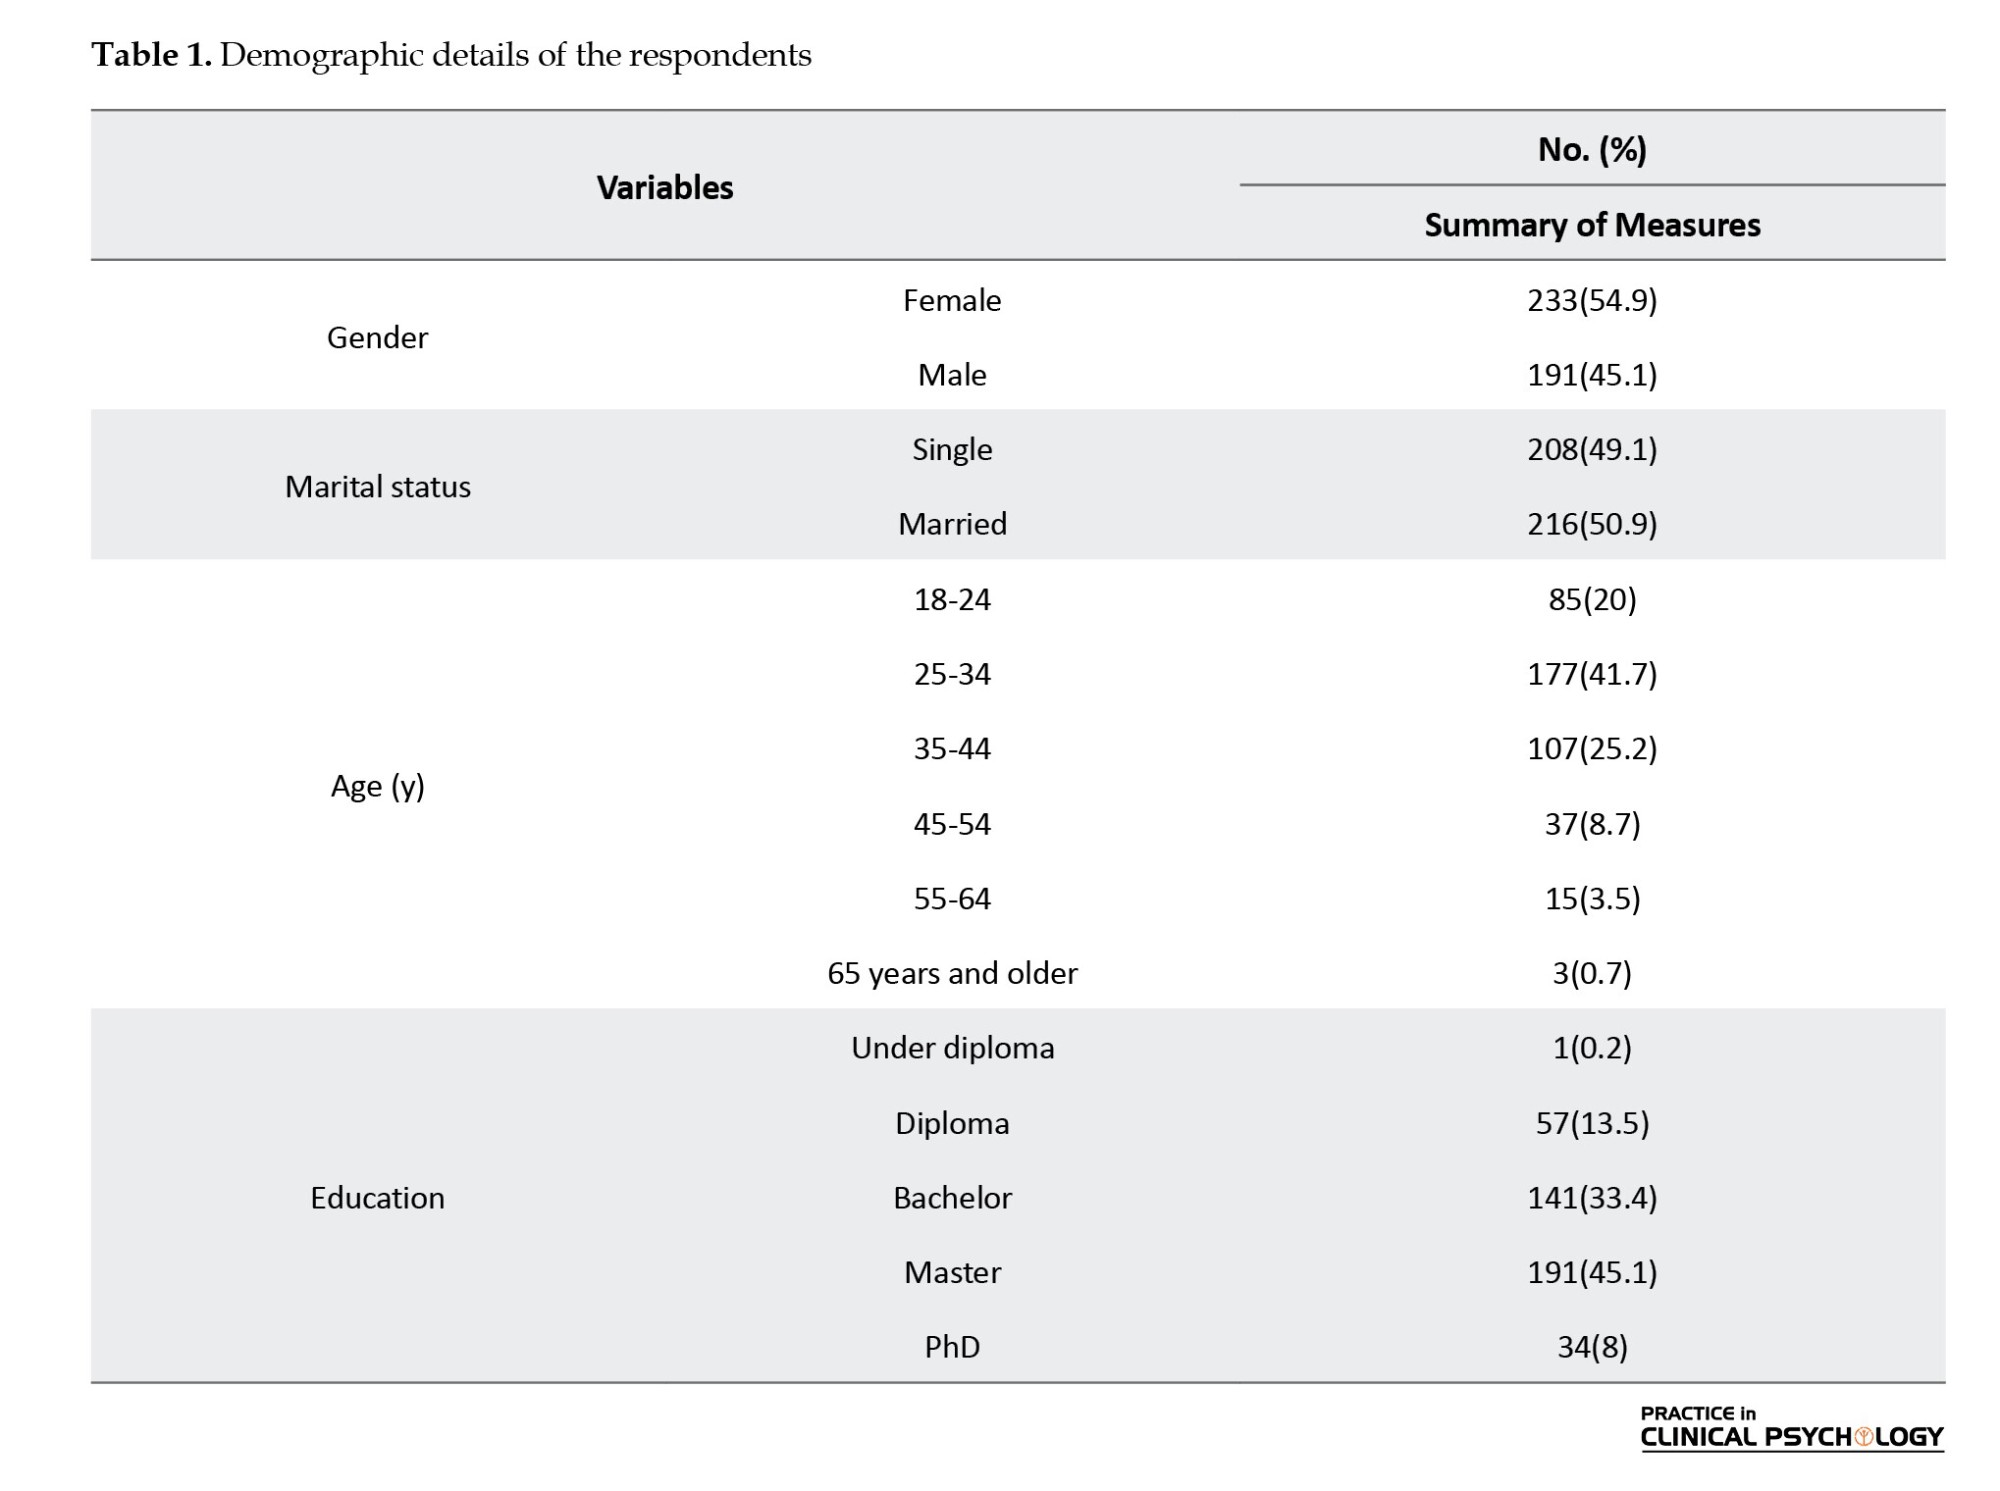
Demographic characteristics of the target population psychometric analyses were performed on data obtained from 424 sample individuals. Demographic details of the respondents are outlined in Table 1. The sample was predominantly composed of individuals with four or more years of university education.
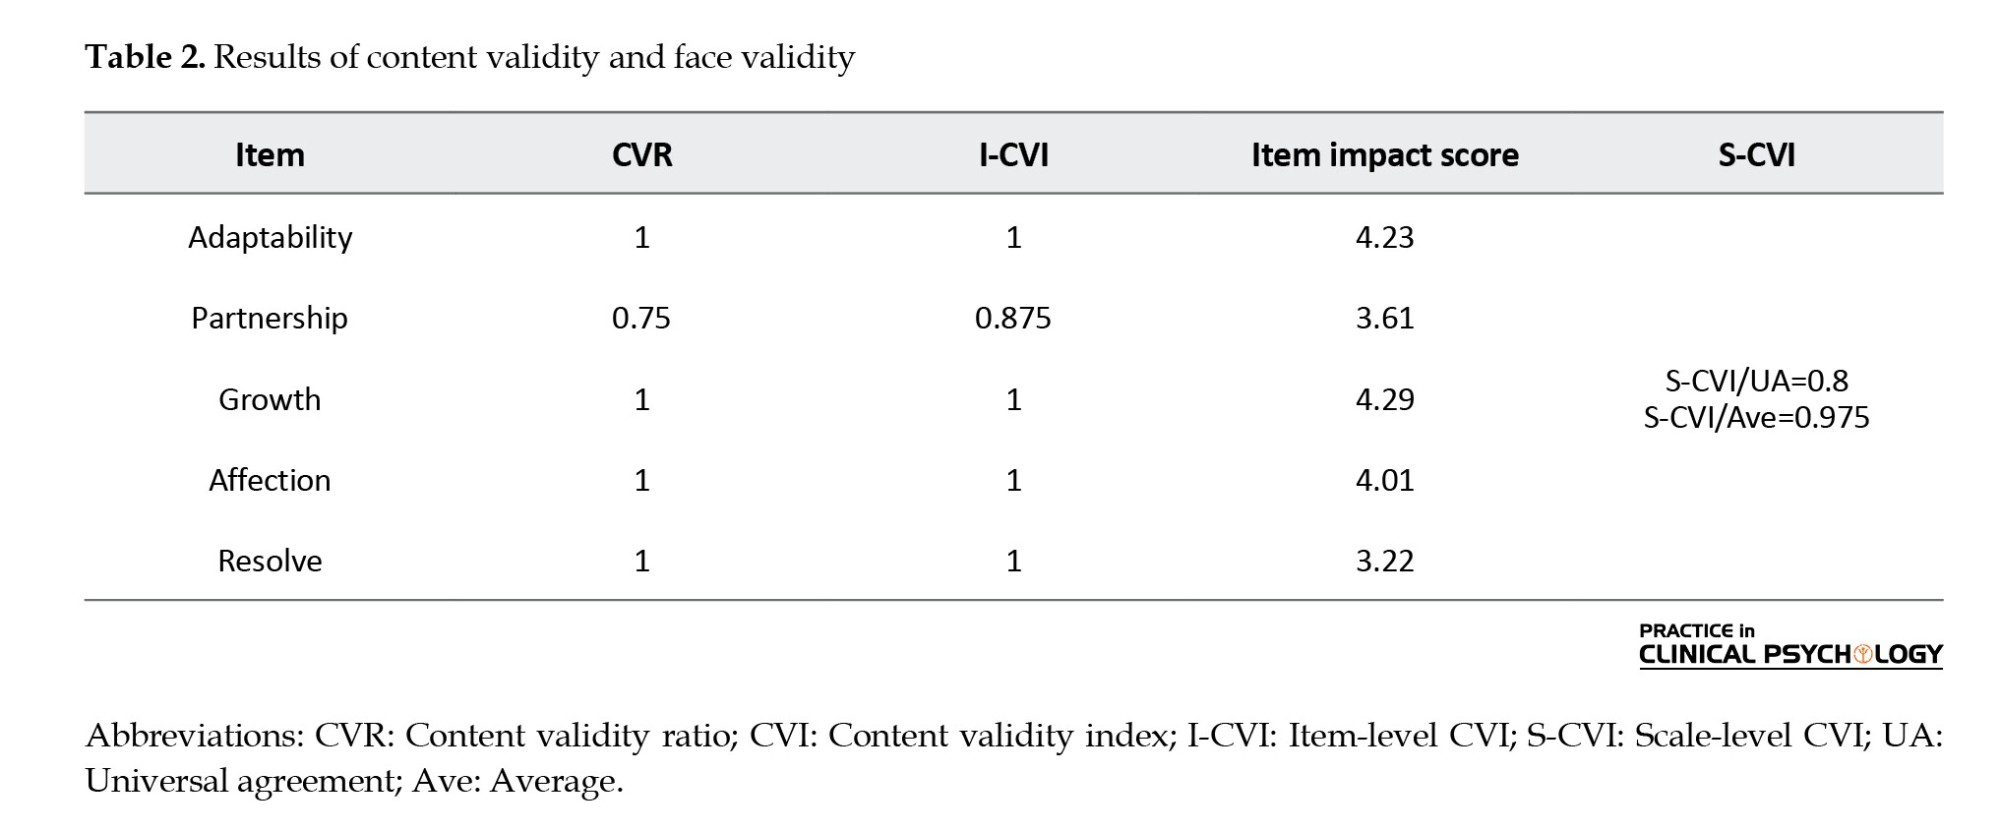
As part of the content validity assessment, 8 experts evaluated all phrases of the questionnaire as “highly relevant,” except for item two, which was deemed highly relevant and essential by seven experts. According to the results presented in Table 2, all items of the questionnaire exhibit excellent content validity, and there is no need to modify or remove any of them.
The results of the item-impact scores related to face validity are presented in Table 2. All values exceed 1.5 and range from 3.22 to 4.29, indicating an appropriate and acceptable impact of the items in assessing the targeted construct.
Criterion validity
In the assessment of criterion validity, a positive and significant correlation was found between the APGAR scale and FOCS (r=0.6, P<0.001).
Test re-test results
Thirty individuals with demographic characteristics similar to those of the target population were instructed to complete the questionnaire in two separate sessions, spaced two weeks apart. The sample comprised 17 women (56.7%) and 13 men (43.3%), of whom 40% were married. Most participants held a bachelor’s degree (40%) or a master’s degree (33.3%). The majority of participants fell within the 25–34 years old range (33.3%). The Cronbach α for the test re-test was estimated at 0.946, and the intraclass correlation coefficient (ICC) was 0.897 (P<0.001). Overall, the data confirm the instrument’s acceptable level of reliability.
Inter-item correlations
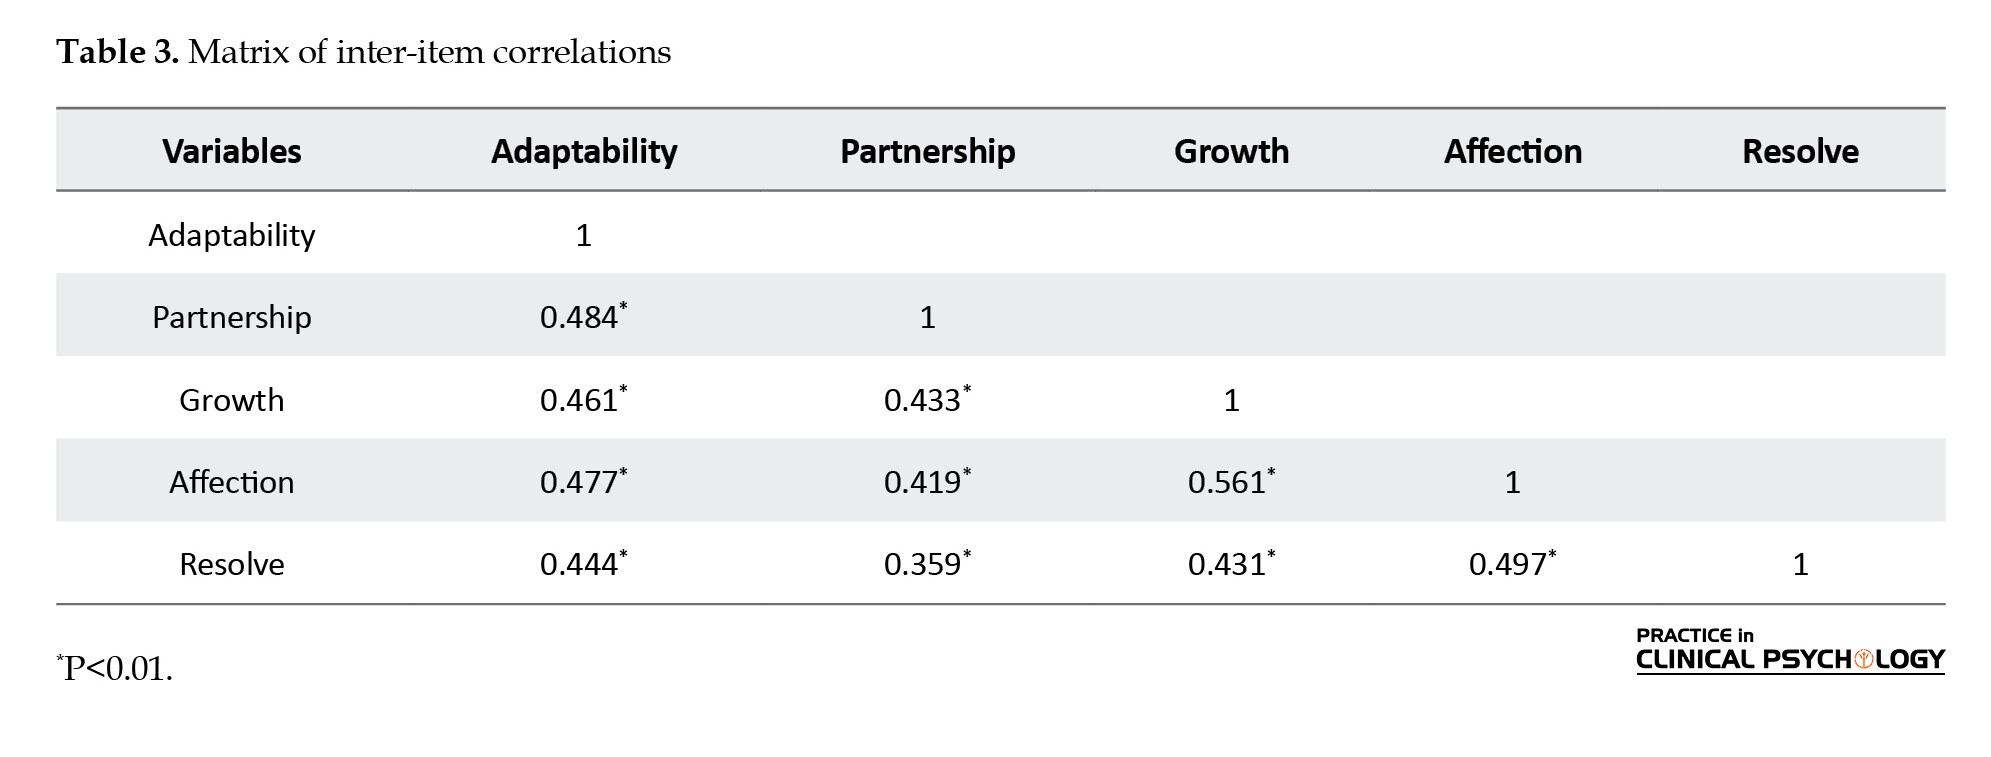
The outcomes of the item correlation analysis indicated acceptable correlations among the questionnaire items, with correlations ranging from 0.359 to 0.561 (P<0.01). Table 3 presents the Pearson correlation matrix. Additionally, the Cronbach α was calculated to be 0.808, demonstrating excellent internal consistency of the instrument.
Construct validity
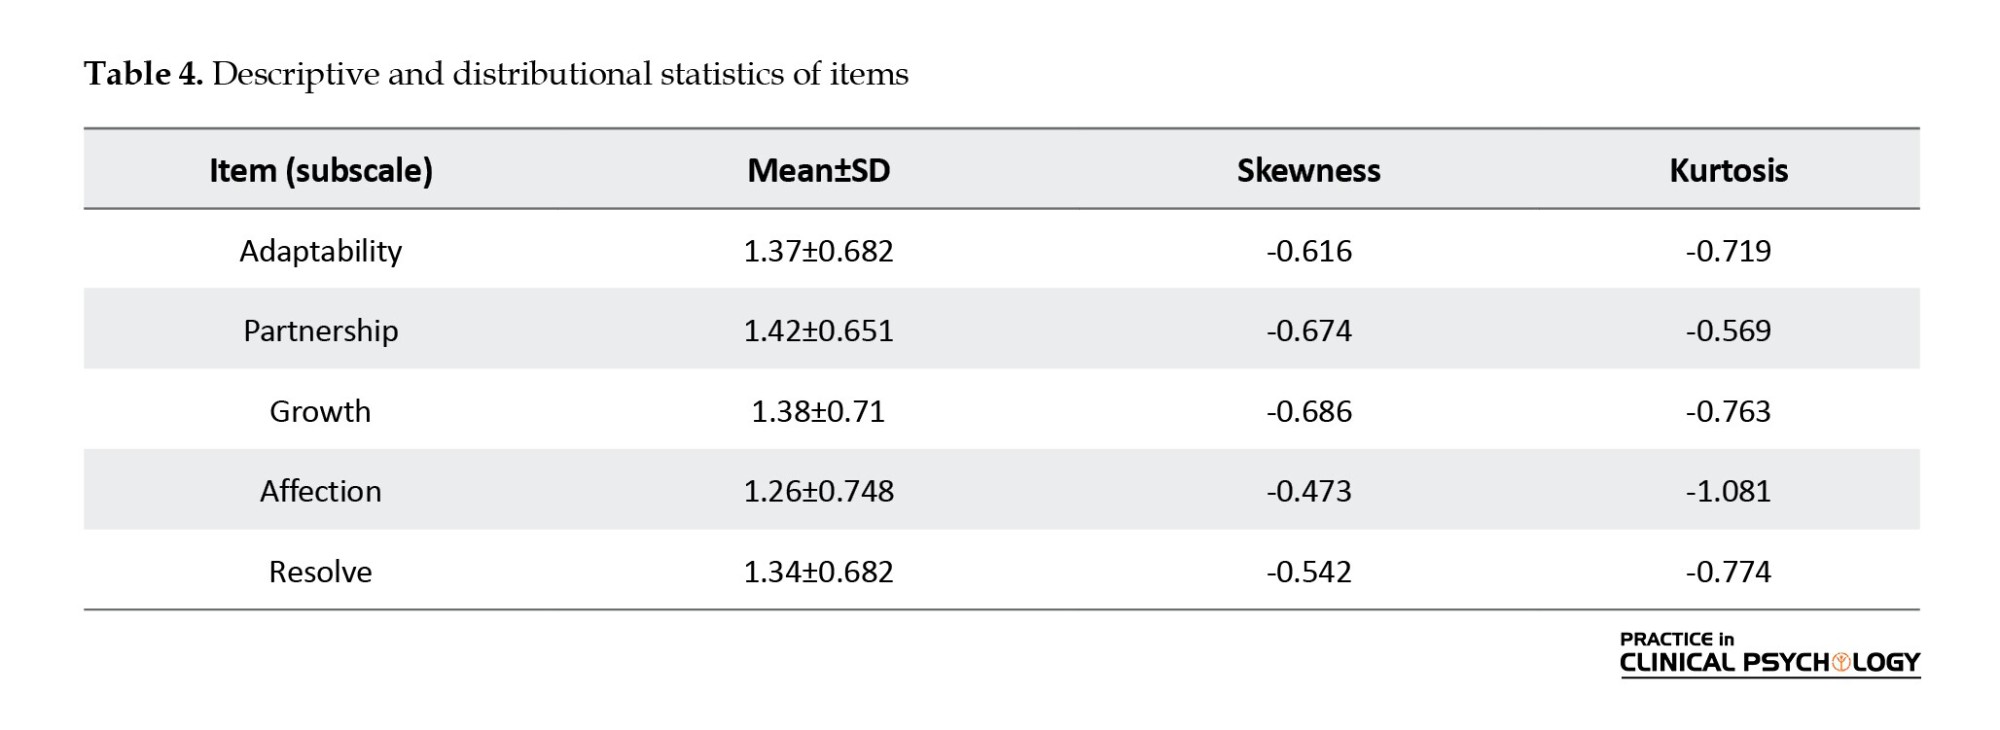
Before the evaluation of construct validity, the items were assessed in terms of skewness and kurtosis. Table 4 presents these findings in conjunction with the associated subscale mean values and standard deviations.
The Shapiro–Wilk test, along with visual assessments via histograms, box plots, and Q–Q plots, indicated that the APGAR item distributions were moderately skewed (–0.473 to –0.686; Standard error [SE]=0.119) and platykurtic (–0.569 to –1.081; SE=0.237). These values fell within the statistically acceptable boundaries defined for maximum likelihood estimation (MLE).
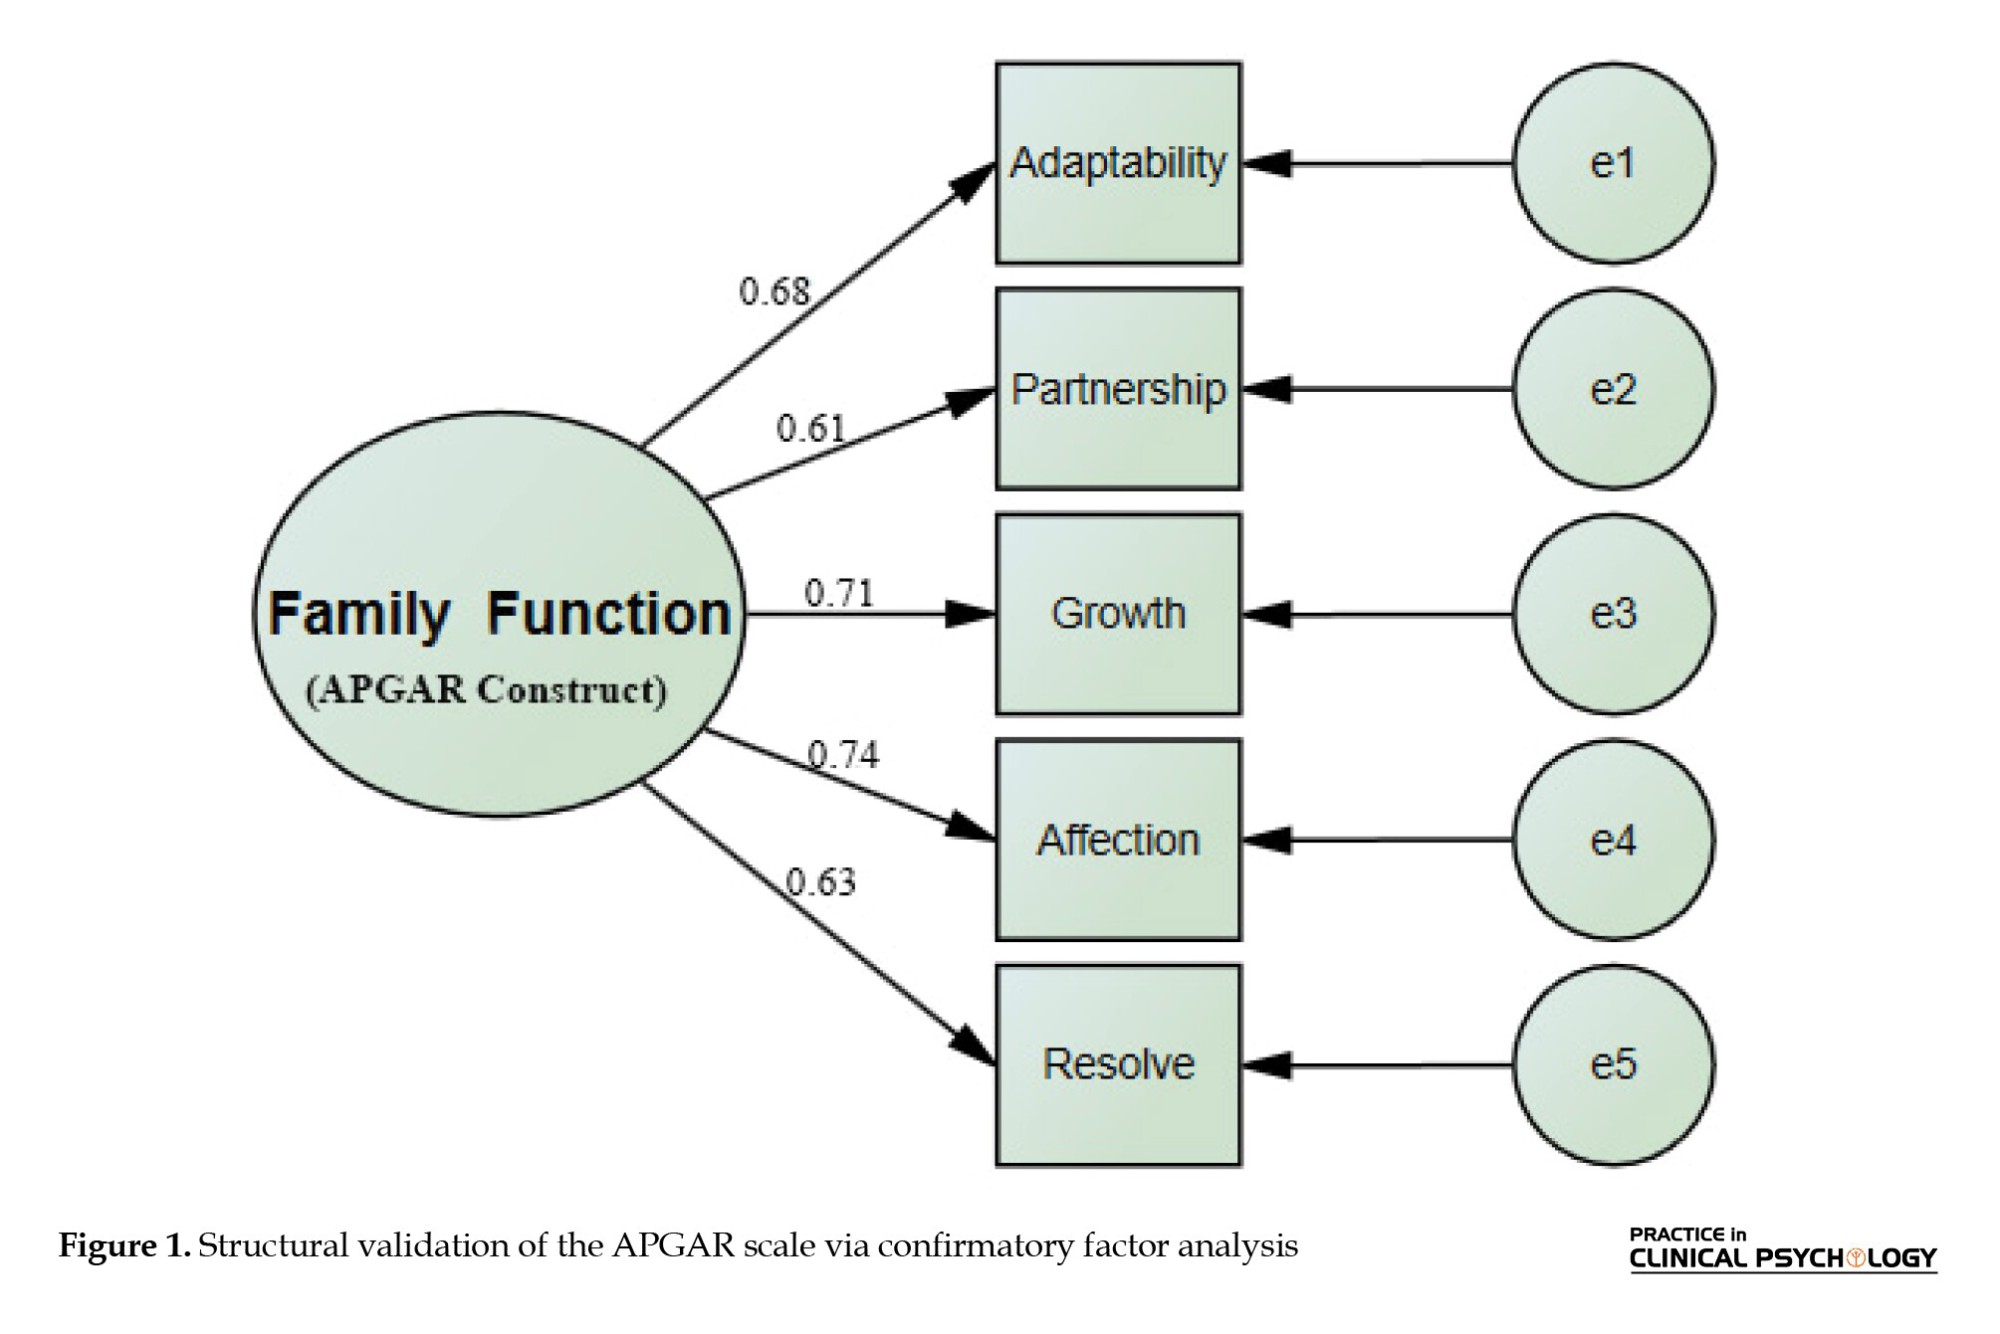
Based on previous studies, one latent variable and 5 subscales have been proposed for the APGAR scale. Consequently, a single latent factor was incorporated into the model specification (family function). Given the acceptable skewness and kurtosis values observed for the items, standardized coefficients were applied, and model parameters were estimated using the MLE approach (Willmer et al., 2019).
After model estimation, the model fit indices were obtained. All indices fell within the established acceptable thresholds, suggesting that the model demonstrates an adequate fit to the data (RMSEA=0.067, GFI=0.968, AGFI=0.959, CFI=0.984, TLI=0.969, NFI=0.977, χ2/df=2.907).
Figure 1 displays the CFA model of the APGAR scale along with its factor loadings. As observed, all factor loadings are significant (P<0.001) and exceed 0.6.
Convergent validity assessment
Using the results of the confirmatory factor analysis, the AVE and CR were generated, yielding an AVE of 0.457 and a CR of 0.807. Although the indicators of convergent validity are relatively supported, the AVE value is slightly below 0.5. This suggests that the amount of shared variance among the items does not reach the optimal level required to ensure complete convergent validity of the construct. Therefore, it can be concluded that the model exhibits relative convergent validity.
Discussion
This study evaluated and standardized the Persian family APGAR in a general adult sample from Tehran. Rigorous face, content, criterion, and construct validity testing—alongside reliability checks (CVR/CVI, Cronbach α, ICC)—demonstrated that the translated questionnaire meets accepted psychometric standards. CFA supported its factor structure and CR, although slightly low AVE points to modest convergent validity. Overall, the instrument remains a robust tool for assessing family functioning in Iran, with future work recommended to strengthen its convergent validity.
An AVE below 0.5 can stem from having few items per construct, suboptimal indicator loadings, or limited shared variance among indicators. Yet if CR exceeds around 0.6–0.7, convergent validity may still be deemed acceptable (Fornell & Larcker, 1981; Muhamad Safiih & Azreen, 2016). In this study’s CFA, every item loaded adequately (all loadings >0.6) on a single family-functioning factor. By examining both AVE and CR, we found that although AVE fell just under the ideal 0.50 cutoff, the strong factor loadings and high CR support a moderate degree of convergent validity for the Persian APGAR scale.
Across diverse cultural settings—from Iranian older adults and the broader adult population in Tehran to Colombian high school students, Spanish families, Bangladeshi participants, and Vietnamese family medicine patients—the family APGAR consistently demonstrates a unidimensional, stable structure and satisfactory psychometric performance. However, variations such as an elevated RMSEA in the Vietnamese sample and the earlier focus on older people in Iran illustrate how cultural norms around family support—whether rooted in intergenerational obligations, emotional expressiveness, or communal decision-making—can subtly influence model fit and convergent validity (Ahamed et al., 2025; Campo-Arias & Caballero-Domínguez, 2021; Karimi et al., 2022; Serrano et al., 2023; Smilkstein, 1978; Trung et al., 2024). The functioning of Iranian families is influenced by emotional-psychological health, family dynamics, economic and educational conditions, media exposure, spousal communication quality, gender roles, inherited power perceptions, partners’ indecisiveness or irresponsibility, sexual concerns, and overall ambivalence (Davoodi et al., 2019; Fazeli et al., 2027). Together, these findings underscore the necessity of rigorous translation, cultural adaptation, and multiple validation studies to ensure the scale accurately captures family functioning across varied normative contexts.
Given the vital impact of familial dynamics in enhancing both the physical and mental health of individuals, the precise and standardized evaluation of this construct can provide valuable foundations for health interventions (Whitehead et al., 2018). For instance, in family medicine clinics, the use of this questionnaire could play an important role in identifying and resolving issues related to family support. Moreover, adapting this instrument to the cultural characteristics of Iranian society is a key factor in its acceptance and widespread utilization in intervention and public health programs. Despite the valuable insights of this study, several limitations should be noted. The sample was drawn from a single geographic area, limiting generalizability to the broader Iranian adult population. Self-report measures may have introduced response bias, especially due to social desirability. Some data were collected via online platforms, which may have led to sampling bias, as active social media users could differ demographically or behaviorally.
Conclusion
The data obtained in this study reveal that the Persian version of the family APGAR questionnaire, despite certain aspects that could be improved, such as the AVE value in the confirmatory factor analysis, meets conventional standards for content and construct validity, alongside consistent reliability indices. This instrument serves as an efficient measure for assessing family functioning among the Iranian adult population.
Ethical Considerations
Compliance with ethical guidelines
This study was approved by the Ethics Committee of Shiraz Branch, Islamic Azad University, Shiraz, Iran (Code: IR.IAU.SHIRAZ.REC.1404.169).
Funding
This research did not receive any grant from funding agencies in the public, commercial, or non-profit sectors.
Authors' contributions
All authors contributed equally to the conception and design of the study, data collection and analysis, interception of the results and drafting of the manuscript. Each author approved the final version of the manuscript for submission.
Conflict of interest
The authors declared no conflict of interest.
References
Family functioning is a cornerstone of psychological resilience and well-being. This observation indicates that family-level interventions are pivotal in both preventing and mitigating mental disorders throughout life. Considering that mental disorders are among the major challenges in public health and affect at least one in every four individuals, family-based interventions can not only help improve individual mental health but also strengthen and maintain the overall mental health of the family system (Marth et al., 2022).
A substantial body of research indicates that the quality of family functioning exerts a profound influence on the psychological well-being of individual family members. Families that exhibit cohesion, emotional support, and effective communication generally experience better mental health outcomes among their members (Lin et al., 2022). According to the multi-level systems theory of the family, the family’s internal dynamics not only shape its structural balance but also critically inform the psychological and behavioral trajectories of its members (Cook & Kenny, 2006).
To date, several instruments have been designed to assess family functioning.
The 5-item family adaptability, partnership, growth, affection, resolve (APGAR), developed by Smilkstein, provides a unidimensional measure of family functioning with strong legacy support across age ranges (Smilkstein et al., 1982; Duarte & Cianciarullo, 2002; Santos & Pavarini, 2012; Smilkstein, 1978; Torres et al., 2009). The utilization of this tool enables the identification of dysfunctional elements within the family system, thereby paving the way for implementing effective interventions aimed at restoring balance to family relationships (Silva et al., 2014).
Cross-cultural studies in diverse settings (e.g. Latin America, East Asia) underscore the need for localized psychometric evaluation (Sh et al., 2009). For instance, the reliability and validity of the translated version of this questionnaire have been thoroughly assessed by Brazilian researchers in (Silva et al., 2014), Vietnam (Trung et al., 2024), Peru (Castilla et al., 2014), Korea (Kang et al., 1984), Indonesia (Ridwan et al., 2023), and Taiwan (Tsai & Sun, 2013). In Iran, a study sought to investigate the measurement properties of the aforementioned questionnaire in individuals aged 60 and above. Although the family APGAR scale has demonstrated robust psychometric properties in older geriatric populations in Iran (Karimi et al., 2022), its applicability to younger and middle-aged adults remains underexplored. Given that family dynamics and perceived support can vary significantly across the lifespan—particularly during adulthood when individuals often navigate complex roles as partners, parents, and caregivers—validating the scale in this demographic is both timely and essential. This study addresses a critical gap by evaluating the scale’s reliability and construct validity in a general adult sample, thereby extending its utility beyond geriatric contexts and enhancing its relevance for broader mental health screening and family-based interventions.
Materials and Methods
This study employed a cross-sectional design to examine the psychometric robustness of the family APGAR questionnaire, focusing on its validity and reliability, from June to July 2025. In this investigation, content validity, face validity, construct validity via confirmatory factor analysis, convergent validity, criterion validity, and the instrument’s reliability were assessed.
Participants voluntarily consented to take part in the study after receiving comprehensive information regarding its objectives. The study population comprised adult residents (over 18 years old) of Tehran City, Iran. Convenience sampling yielded a total of 424 participants for inclusion in the study. Eligibility for participation required being Iranian, 18 years or older, literate in Persian, and free from any clinically diagnosed psychiatric disorder. Participants who did not complete the questionnaires or did not meet the eligibility criteria were excluded from the final analysis. A preliminary pilot test was conducted with 30 participants to evaluate the comprehensibility and procedural integrity of the survey materials.
The instruments employed in the present study included the APGAR scale and the family organized cohesion scale (FOCS). Originally developed by Smilkstein in 1978, the family APGAR scale has shown satisfactory reliability, with Cronbach α values reported between 0.8 and 0.86. The scale comprises five items that assess family functioning across five principal domains. Responses are recorded on a three-point Likert scale, whereby participants express their agreement or disagreement with each item (0=seldom, 1=sometimes, 2=almost always). The resulting scores reflect family functioning as follows: a score between 8 and 10 signifies a family with optimal functioning and high cohesion; a score between 4 and 7 indicates moderate and somewhat suboptimal functioning; and a score between 0 and 3 denotes a family with poor functioning and low cohesion (Smilkstein, 1978; Smilkstein et al., 1982).
Furthermore, criterion validity was assessed through the correlation analysis between scores obtained from the APGAR scale and those from the FOCS. This latter instrument is a self-report questionnaire consisting of 13 items and four subscales—cohesion, sharedness, leadership clarity, and rule clarity. Responses are recorded using a 6-point Likert scale (1=strongly disagree to 6=strongly agree), with reverse scoring applied to items 2, 4, and 9. The score range of this scale is between 13 and 78; elevated scores reflect an increased level of family cohesion. Fisher et al. yielded a coefficient of 0.78, as measured by the Cronbach α, while in Iran, its internal consistency was calculated at 0.87 (Fisher et al., 1992).
Framework for the translation and cultural adaptation of the APGAR instrument
Using the forward-backward translation approach, the questionnaire was rendered into Persian. The initial translation was conducted independently by two bilingual experts. In the subsequent step of the procedure, the two translated versions were merged and revised. Together with the two translators, the translated version was then examined for its clarity, adherence to commonly used language, conceptual consistency with the original, and overall translation quality. Then, the Persian translation underwent back-translation into English by two independent translators who had not been involved in the initial translation phase. Finally, the original and the back-translated versions were compared in terms of conceptual equivalence. Following expert review and reconciliation, the final Persian translation of the questionnaire was endorsed for use.
Face validity
To determine the face validity of the instrument, 30 individuals with demographic characteristics similar to those of the target population completed the questionnaire. The item impact score was employed to evaluate face validity quantitatively. The Equation 1 was applied to compute the item impact score:
1. Item Impact Score=Frequency (%)×Importance
In this method, the perceived appropriateness of each item was evaluated by participants through a 5-point Likert scale, ranging from 1 (completely unsuitable) to 5 (completely suitable). If the item’s impact score exceeds 1.5, the item is considered appropriate for further analyses (Saneii et al., 2020). In this context, “frequency” refers to the total number of participants who evaluated the item as either ‘suitable’ or ‘completely suitable’ (i.e. ratings of 4 or 5). This value was used to compute face validity, expressed as the ratio of favorable ratings (4 or 5) to the total number of respondents. “Importance” is represented by the mean of all responses (Hardesty & Bearden, 2004). Additionally, 30 participants from the pilot test engaged in structured face-to-face interviews to facilitate the evaluation of qualitative face validity. Participants evaluated each item with respect to its relevance to the subject, clarity, readability, simplicity, and comprehensibility.
Content validity
The content validity ratio (CVR) and the content validity index (CVI) were established to determine the instrument’s content validity based on the evaluations provided by 8 psychologists (Shi et al., 2012; Zamanzadeh et al., 2015).
The CVI is computed using two methods: the item-level CVI (I-CVI) and the scale-level CVI (S-CVI) (Lawshe, 1975). I-CVI is determined as the proportion of experts assigning a ‘highly relevant’ rating to a given item, relative to the total number of evaluators, producing a value within the 0–1 range. According to established criteria, an I-CVI greater than 0.79 reflects adequate relevance, a score between 0.70 and 0.79 denotes the need for revision, and a score under 0.70 warrants item removal.
Determination of the S-CVI relies on the count of items within the questionnaire that were assigned a ‘highly relevant’ rating. Its calculation is typically performed using two widely adopted methods, the universal agreement method (S-CVI/UA) and the average CVI method (S-CVI/Ave). S-CVI/UA represents the ratio of items unanimously rated as relevant (I-CVI=1) to the total number of questionnaire items. Conversely, S-CVI/Ave is derived by summing the I-CVI scores for all items and dividing this total by the overall number of items (Zamanzadeh et al., 2015). Thresholds of ≥0.8 for S-CVI/UA and ≥0.9 for S-CVI/Ave are indicative of favorable content validity (Shi et al., 2012).
To compute the CVR, the necessity and importance of each item were evaluated on a three-point Likert scale by eight psychologists (Yamada et al., 2010). CVR scores range between -1 and +1, with higher scores indicating a greater degree of expert consensus. To compute the CVR, the Equation 2 is applied:
“Ne” corresponds to the count of experts identifying the item as “essential,” and N signifies the overall number of expert panel members. According to Lawshe’s critical values (Lawshe, 1975), a CVR exceeding 0.75 for eight specialists is acceptable and indicates that the item is appropriate for inclusion in the questionnaire.
Criterion validity
To assess criterion validity, the correlation between the total scores of the APGAR questionnaire and those obtained from the FOCS was examined. It was anticipated that the Family APGAR would have a positive and significant relationship with this scale. In this analysis, A Pearson r value equal to or exceeding 0.40 was deemed indicative as satisfactory, thereby indicating adequate validity of the instrument in measuring constructs related to family functioning.
Construct validity
Confirmatory factor analysis (CFA) was conducted to examine the construct validity. Average variance extracted (AVE) and composite reliability (CR) were utilized as key measures in evaluating convergent validity and overall construct reliability. For convergent validity to be established, all factor loadings must exceed 0.6 and be statistically significant. Furthermore, the AVE should be higher than 0.5, and the CR should exceed 0.6, thereby confirming that the construct demonstrates satisfactory reliability (Awang, 2015).
To evaluate the model fitness in the CFA, various fit indices were employed. Excluding the non-significance requirement of the P associated with the chi-square statistic—typically not applicable for large samples (i.e. >200)—the other indices and their minimum acceptable values were as follows (Awang, 2015): the root mean square error of approximation (RMSEA) should be <0.08; the comparative fit index (CFI), the goodness-of-fit index (GFI), Tucker-Lewis index (TLI), normed fit index (NFI), and the adjusted goodness-of-fit index (AGFI) should each exceed 0.9; and χ2/df should be <3.
Reliability
The reliability of the questionnaire was computed via the Cronbach α, which is deemed satisfactory if it exceeds 0.7. Additionally, scale stability was assessed through the test re-test procedure. For this purpose, a pilot test was conducted on 30 individuals possessing demographic characteristics similar to those of the target population. After a two-week interval, the participants completed the questionnaire again under identical conditions. The two administrations were then compared using the intraclass correlation coefficient (ICC), yielding an ICC above 0.8, indicating a desirable level of stability for the instrument (Nunnally, 1978).
To analyze the inter-item correlation, if an item yields a correlation coefficient greater than 0.30, it is retained within the questionnaire, as this indicates sufficient association with the instrument’s overall construct (Ridwan et al., 2023).
Statistical analysis
SPSS software, version 27 and AMOS software, version 24, both from IBM Corp., were utilized for data analysis. For descriptive analysis, quantitative variables were presented as Mean±SD, and categorical variables as frequency and percentage.
Results
Demographic characteristics of the target population psychometric analyses were performed on data obtained from 424 sample individuals. Demographic details of the respondents are outlined in Table 1. The sample was predominantly composed of individuals with four or more years of university education.
As part of the content validity assessment, 8 experts evaluated all phrases of the questionnaire as “highly relevant,” except for item two, which was deemed highly relevant and essential by seven experts. According to the results presented in Table 2, all items of the questionnaire exhibit excellent content validity, and there is no need to modify or remove any of them.
The results of the item-impact scores related to face validity are presented in Table 2. All values exceed 1.5 and range from 3.22 to 4.29, indicating an appropriate and acceptable impact of the items in assessing the targeted construct.
Criterion validity
In the assessment of criterion validity, a positive and significant correlation was found between the APGAR scale and FOCS (r=0.6, P<0.001).
Test re-test results
Thirty individuals with demographic characteristics similar to those of the target population were instructed to complete the questionnaire in two separate sessions, spaced two weeks apart. The sample comprised 17 women (56.7%) and 13 men (43.3%), of whom 40% were married. Most participants held a bachelor’s degree (40%) or a master’s degree (33.3%). The majority of participants fell within the 25–34 years old range (33.3%). The Cronbach α for the test re-test was estimated at 0.946, and the intraclass correlation coefficient (ICC) was 0.897 (P<0.001). Overall, the data confirm the instrument’s acceptable level of reliability.
Inter-item correlations
The outcomes of the item correlation analysis indicated acceptable correlations among the questionnaire items, with correlations ranging from 0.359 to 0.561 (P<0.01). Table 3 presents the Pearson correlation matrix. Additionally, the Cronbach α was calculated to be 0.808, demonstrating excellent internal consistency of the instrument.
Construct validity
Before the evaluation of construct validity, the items were assessed in terms of skewness and kurtosis. Table 4 presents these findings in conjunction with the associated subscale mean values and standard deviations.
The Shapiro–Wilk test, along with visual assessments via histograms, box plots, and Q–Q plots, indicated that the APGAR item distributions were moderately skewed (–0.473 to –0.686; Standard error [SE]=0.119) and platykurtic (–0.569 to –1.081; SE=0.237). These values fell within the statistically acceptable boundaries defined for maximum likelihood estimation (MLE).
Based on previous studies, one latent variable and 5 subscales have been proposed for the APGAR scale. Consequently, a single latent factor was incorporated into the model specification (family function). Given the acceptable skewness and kurtosis values observed for the items, standardized coefficients were applied, and model parameters were estimated using the MLE approach (Willmer et al., 2019).
After model estimation, the model fit indices were obtained. All indices fell within the established acceptable thresholds, suggesting that the model demonstrates an adequate fit to the data (RMSEA=0.067, GFI=0.968, AGFI=0.959, CFI=0.984, TLI=0.969, NFI=0.977, χ2/df=2.907).
Figure 1 displays the CFA model of the APGAR scale along with its factor loadings. As observed, all factor loadings are significant (P<0.001) and exceed 0.6.
Convergent validity assessment
Using the results of the confirmatory factor analysis, the AVE and CR were generated, yielding an AVE of 0.457 and a CR of 0.807. Although the indicators of convergent validity are relatively supported, the AVE value is slightly below 0.5. This suggests that the amount of shared variance among the items does not reach the optimal level required to ensure complete convergent validity of the construct. Therefore, it can be concluded that the model exhibits relative convergent validity.
Discussion
This study evaluated and standardized the Persian family APGAR in a general adult sample from Tehran. Rigorous face, content, criterion, and construct validity testing—alongside reliability checks (CVR/CVI, Cronbach α, ICC)—demonstrated that the translated questionnaire meets accepted psychometric standards. CFA supported its factor structure and CR, although slightly low AVE points to modest convergent validity. Overall, the instrument remains a robust tool for assessing family functioning in Iran, with future work recommended to strengthen its convergent validity.
An AVE below 0.5 can stem from having few items per construct, suboptimal indicator loadings, or limited shared variance among indicators. Yet if CR exceeds around 0.6–0.7, convergent validity may still be deemed acceptable (Fornell & Larcker, 1981; Muhamad Safiih & Azreen, 2016). In this study’s CFA, every item loaded adequately (all loadings >0.6) on a single family-functioning factor. By examining both AVE and CR, we found that although AVE fell just under the ideal 0.50 cutoff, the strong factor loadings and high CR support a moderate degree of convergent validity for the Persian APGAR scale.
Across diverse cultural settings—from Iranian older adults and the broader adult population in Tehran to Colombian high school students, Spanish families, Bangladeshi participants, and Vietnamese family medicine patients—the family APGAR consistently demonstrates a unidimensional, stable structure and satisfactory psychometric performance. However, variations such as an elevated RMSEA in the Vietnamese sample and the earlier focus on older people in Iran illustrate how cultural norms around family support—whether rooted in intergenerational obligations, emotional expressiveness, or communal decision-making—can subtly influence model fit and convergent validity (Ahamed et al., 2025; Campo-Arias & Caballero-Domínguez, 2021; Karimi et al., 2022; Serrano et al., 2023; Smilkstein, 1978; Trung et al., 2024). The functioning of Iranian families is influenced by emotional-psychological health, family dynamics, economic and educational conditions, media exposure, spousal communication quality, gender roles, inherited power perceptions, partners’ indecisiveness or irresponsibility, sexual concerns, and overall ambivalence (Davoodi et al., 2019; Fazeli et al., 2027). Together, these findings underscore the necessity of rigorous translation, cultural adaptation, and multiple validation studies to ensure the scale accurately captures family functioning across varied normative contexts.
Given the vital impact of familial dynamics in enhancing both the physical and mental health of individuals, the precise and standardized evaluation of this construct can provide valuable foundations for health interventions (Whitehead et al., 2018). For instance, in family medicine clinics, the use of this questionnaire could play an important role in identifying and resolving issues related to family support. Moreover, adapting this instrument to the cultural characteristics of Iranian society is a key factor in its acceptance and widespread utilization in intervention and public health programs. Despite the valuable insights of this study, several limitations should be noted. The sample was drawn from a single geographic area, limiting generalizability to the broader Iranian adult population. Self-report measures may have introduced response bias, especially due to social desirability. Some data were collected via online platforms, which may have led to sampling bias, as active social media users could differ demographically or behaviorally.
Conclusion
The data obtained in this study reveal that the Persian version of the family APGAR questionnaire, despite certain aspects that could be improved, such as the AVE value in the confirmatory factor analysis, meets conventional standards for content and construct validity, alongside consistent reliability indices. This instrument serves as an efficient measure for assessing family functioning among the Iranian adult population.
Ethical Considerations
Compliance with ethical guidelines
This study was approved by the Ethics Committee of Shiraz Branch, Islamic Azad University, Shiraz, Iran (Code: IR.IAU.SHIRAZ.REC.1404.169).
Funding
This research did not receive any grant from funding agencies in the public, commercial, or non-profit sectors.
Authors' contributions
All authors contributed equally to the conception and design of the study, data collection and analysis, interception of the results and drafting of the manuscript. Each author approved the final version of the manuscript for submission.
Conflict of interest
The authors declared no conflict of interest.
References
Ahamed, M. S., Rahman, M. S., Ali, M., & Orin, F. S. (2025). Validation and adaptation of family adaptation, partnership, growth, affection, resolve (APGAR): Tool in bengali to see individual’s level of satisfaction about family relationship. Global Journal of Health Sciences and Research, [Unpublished]. [DOI:10.25259/GJHSR_22_2024]
Awang, Z. (2015). Validating the measurement model. In WMAW. Afthanorhan, (Ed.). A handbook on SEM zainudin awang -universiti sultan zainal abidin the models involved in structural equation modeling (pp. 53-74). Kuala Terengganu: Universiti Sultan Zainal Abidin. [Link]
Campo-Arias, A., & Caballero-Domínguez, C. C. (2020). Confirmatory factor analysis of the family APGAR questionnaire. Revista Colombiana de psiquiatria, S0034-7450(20)30022-6. [DOI:10.1016/j.rcpeng.2021.10.002] [PMID]
Castilla, H., Caycho, T., Shimabukuro, M., & Valdivia, A. (2014). Perception of family functioning: psychometric analysis of family APGAR scale in adolescents in Lima. Journal of Educational Psychology-Propósitos y Representaciones, 2(1), 65-78. [DOI:10.20511/pyr2014.v2n1.53]
Cook, W. L., & Kenny, D. A. (2006). Examining the validity of self-report assessments of family functioning: A question of the level of analysis. Journal of Family Psychology, 20(2), 209. [DOI:10.1037/0893-3200.20.2.209] [PMID]
Davoodi, Z., Fatehizade, M., Ahmadi, A., & Jazayeri, R. (2019). Culture and power: How do culture and power influence Iranian couples. Journal of Couple & Relationship Therapy, 18(4), 353-365. [DOI:10.1080/15332691.2019.1620146]
Duarte, Y. A. d. O., & Cianciarullo, T. I. (2002). [Família: Rede de suporte ou fator estressor. A Ótica de Idosos e Cuidadores Familiares (Portuguese)]. São Paulo: EEUSP. [Link]
Fazeli, S. M., Salehi Amiri, D. S. R., Azizabadi Farahani, F., Mohammad Khani, D. K., & Baghi, D. A. (2027). The role of factors affecting the strength of the Iranian family (case study of Qom province). Bi-Quarterly Journal of Cultural Guardianship of the Islamic, 16(34), 1-39. [Link]
Fisher, L., Ransom, D. C., Terry, H. E., & Burge, S. (1992). The California family health project: IV. Family structure/organization and adult health. Family Process, 31(4), 399-419. [DOI:10.1111/j.1545-5300.1992.00399.x] [PMID]
Fornell, C., & Larcker, D. F. (1981). Evaluating structural equation models with unobservable variables and measurement error. Journal of Marketing Research, 18(1), 39-50. [DOI:10.2307/3151312]
Hardesty, D. M., & Bearden, W. O. (2004). The use of expert judges in scale development: Implications for improving face validity of measures of unobservable constructs. Journal of Business Research, 57(2), 98-107. [DOI:10.1016/S0148-2963(01)00295-8]
Kang, S., Young, B., Lee, H., Lee, D., & Shim, U. (1984). [A study of family APGAR scores for evaluating family function (Korean)]. Journal of the Korean Academy of Family Medicine, 5(12), 6-13. [Link]
Karimi, Z., Taheri-Kharameh, Z., & Sharififard, F. (2022). Cultural adaption and psychometric analysis of family APGAR scale in Iranian older people. Korean Journal of Family Medicine, 43(2), 141. [DOI:10.4082/kjfm.21.0028] [PMID]
Lawshe, C. H. (1975). A quantitative approach to content validity. Personnel Psychology, 28(4), 563-575. [DOI:10.1111/j.1744-6570.1975.tb01393.x]
LIN, H., HUANG, Q. K., & TONG, S. L. (2022). Effects of family function and stress feeling on the mental health of adolescents. Chinese Journal of Child Health Care, 30(12), 1380. [DOI:10.11852/zgetbjzz2021-1701]
Marth, S., Cook, N., Bain, P., & Lindert, J. (2022). Family factors contribute to mental health conditions-A systematic review. European Journal of Public Health, 32(Supplement_3), ckac129.454. [DOI:10.1093/eurpub/ckac129.454]
Muhamad Safiih, L., & Azreen, N. (2016). Confirmatory factor analysis approach. Malaysian Journal of Mathematical Sciences, 2(1), 23-30. [Link]
Nunnally, J. C. (1978). Psychometric theory 2. New York: McGraw-Hill. [Link]
Ridwan, E. S., Sarwadhamana, R. J., & Rofiyati, W. (2023). Measuring family functioning: validation and adaptation of the family APGAR into Indonesian. JNKI (Jurnal Ners dan Kebidanan Indonesia) (Indonesian Journal of Nursing and Midwifery), 10(4), 348-355. [DOI:10.21927/jnki.2022.10(4).348-355]
Saneii, S. H., Heidari, M., Zaree, M., & Akbarfahimi, M. (2020). Psychometric features of the Persian version of the fatigue impact scale in Iranian stroke patients. Journal of Advances in Medical and Biomedical Research, 28(127), 111-118. [DOI:10.30699/jambs.28.127.111]
Santos, A. A. d., & Pavarini, S. C. I. (2012). Funcionalidade familiar de idosos com alterações cognitivas: A percepção do cuidador. Revista da Escola de Enfermagem da USP, 46, 1141-1147. [DOI:10.1590/S0080-62342012000500015] [PMID]
Serrano, L., Vela, E., & Martín, L. (2023). Analysis of the functioning of families of children with autism spectrum disorder: a psychometric study of the family APGAR scale. International Journal of Environmental Research and Public Health, 20(23), 7106. [DOI:10.3390/ijerph20237106] [PMID]
Sh, P., Khaghanizade, M., & Ebadi, A. (2009). Review of translation and cultural adaptation process of questionnaires. Bimonthly of Education Strategies in Medical Sciences, 2(3), 117-120. [Link]
Shi, J., Mo, X., & Sun, Z. (2012). Content validity index in scale development. Yi xue ban, 37(2), 152-155. [DOI:10.3969/j.issn.1672-7347.2012.02.007] [PMID]
Silva, M. J. d., Victor, J. F., Mota, F. R. d. N., Soares, E. S., Leite, B. M. B., & Oliveira, E. T. (2014). Analysis of psychometric properties of family APGAR with elderly in northeast Brazil. Escola Anna Nery, 18, 527-532. [DOI:10.5935/1414-8145.20140075]
Smilkstein, G. (1978). The family APGAR: A proposal for a family function test and its use by physicians. Journal of Family Practice, 6(6), 1231-1239. [DOI:10.1037/t90278-000]
Smilkstein, G., Ashworth, C., & Montano, D. (1982). Validity and reliability of the family APGAR as a test of family function. Journal of Family Practice, 15(2), 303-311. [Link]
Torres, G. d. V., Reis, L. A. d., Reis, L. A. d., & Fernandes, M. H. (2009). Quality of life and associated factors in functionally dependent elderly in the hinterland of Northeast Brazil. Jornal Brasileiro de Psiquiatria, 58(1), 39-44. [DOI:10.1590/S0047-20852009000100006]
Trung, H. S., Nhu, N. V., Le, T. L., Thanh, L. T., & Le, P. A. (2024). Reliability and validity of the apgar family scale in family medicine clinics in Ho Chi Minh City, Vietnam. Tạp chí Y học Việt Nam, 544(2), 96-104. [DOI:10.51298/vmj.v544i2.11935]
Tsai, S. Y., & Sun, W. J. (2013). Evaluating the satisfaction of immigrant women from a rural community regarding family functioning and health-related quality of life. Women & Health, 53(2), 135-153. [DOI:10.1080/03630242.2013.767302]
Whitehead, L., Jacob, E., Towell, A., Abu‐qamar, M. E., & Cole‐Heath, A. (2018). The role of the family in supporting the self‐management of chronic conditions: A qualitative systematic review. Journal of Clinical Nursing, 27(1-2), 22-30. [DOI:10.1111/jocn.13775] [PMID]
Willmer, M., Westerberg Jacobson, J., & Lindberg, M. (2019). Exploratory and confirmatory factor analysis of the 9-item Utrecht work engagement scale in a multi-occupational female sample: a cross-sectional study. Frontiers in Psychology, 10, 2771. [DOI:10.3389/fpsyg.2019.02771] [PMID]
Yamada, J., Stevens, B., Sidani, S., Watt‐Watson, J., & De Silva, N. (2010). Content validity of a process evaluation checklist to measure intervention implementation fidelity of the EPIC intervention. Worldviews on Evidence-Based Nursing, 7(3), 158-164. [DOI:10.1111/j.1741-6787.2010.00182.x] [PMID]
Zamanzadeh, V., Ghahramanian, A., Rassouli, M., Abbaszadeh, A., Alavi-Majd, H., & Nikanfar, A.-R. (2015). Design and implementation content validity study: development of an instrument for measuring patient-centered communication. Journal of Caring Sciences, 4(2), 165. [DOI:10.15171/jcs.2015.017] [PMID]
Type of Study: Original Research Article |
Subject:
Psychometric
Received: 2025/08/5 | Accepted: 2025/09/8 | Published: 2026/12/28
Received: 2025/08/5 | Accepted: 2025/09/8 | Published: 2026/12/28
| Rights and permissions | |
 |
This work is licensed under a Creative Commons Attribution-NonCommercial 4.0 International License. |
This is an open access article distributed under the terms of the Creative Commons Attribution License (CC-By-NC), which permits use, distribution, and reproduction in any medium, provided the original work is properly cited and is not used for commercial purposes.
Contact Information