

Volume 7, Issue 4 (Autumn 2019)
PCP 2019, 7(4): 303-318 |
Back to browse issues page


Download citation:
BibTeX | RIS | EndNote | Medlars | ProCite | Reference Manager | RefWorks
Send citation to:


BibTeX | RIS | EndNote | Medlars | ProCite | Reference Manager | RefWorks
Send citation to:
Ameli S, Ghaderi S, Aslzaker Lighvan M, Davazdah Emami M H, Dadashzadeh H. Psychometric Properties of the Abridged Version of the Autism-Spectrum Quotient Among Iranian Students. PCP 2019; 7 (4) :303-318
URL: http://jpcp.uswr.ac.ir/article-1-663-en.html
URL: http://jpcp.uswr.ac.ir/article-1-663-en.html
Samira Ameli * 

 1, Saber Ghaderi2 , Maryam Aslzaker Lighvan2 , Mohammad Hassan Davazdah Emami2 , Hossein Dadashzadeh2
1, Saber Ghaderi2 , Maryam Aslzaker Lighvan2 , Mohammad Hassan Davazdah Emami2 , Hossein Dadashzadeh2
1- Department of Clinical Psychology, Faculty of Medicine, Shahid Beheshti University of Medical Sciences, Tehran, Iran. , ameli.samira@sbmu.ac.ir
2- Department of Clinical Psychology, Faculty of Medicine, Shahid Beheshti University of Medical Sciences, Tehran, Iran.
2- Department of Clinical Psychology, Faculty of Medicine, Shahid Beheshti University of Medical Sciences, Tehran, Iran.
Full-Text [PDF 831 kb]
(1544 Downloads)
| Abstract (HTML) (3377 Views)


The detection coefficient of questions ranged between 0.2 and 0.8, which indicated their difficulty. Although they have a high level of difficulty and questions with a difficulty of 0.3 had the highest detection coefficient, the most difficult questions had a good detection coefficient. In other words, easy questions had the lowest detection coefficient (Table 4).


Full-Text: (2166 Views)
1. Introduction
Autistic Spectrum Disorders (ASDs) are a group of neurodevelopmental disorders characterized by deficiencies in communication and social interaction across multiple contexts during the whole life, as well as the patterns of the restricted and repetitive behaviors and interests (American Psychiatric Association [APA], 2013). According to the studies, the prevalence of ASDs has increased steadily over the past years and has now reached 1% of the general population (Baxter et al. 2015).
Although autism was formerly known as a disorder, recent evidence recommends that autism spectrum traits are distributed among the general population, and the general population may express autistic traits at subclinical levels (Constantino & Todd, 2003; Robinson et al., 2011). Broad Autism Phenotype (BAP) refers to the milder forms of autism and expresses the subclinical symptoms of autism that do not fill in the clinical criteria (Constantino & Todd, 2003; Hurley, Losh, Parlier, Reznick, & Piven, 2007). Kanner and Eisenberg observed BAP, which refers to the mild traits of autism, such as practical problems in using language and communication, social interactions, visual attention, sensory perception; as well as obsessive behaviors, extending to cognitive, behavioral, and personality areas (Sucksmith, Roth, & Hoekstra, 2011). Autistic trait symptoms are found not only in the autistic individuals’ families but also in the healthy population with a normal distribution (R. A. Hoekstra, Bartels, Verweij, & Boomsma, 2007; Hurst, Mitchell, Kimbrel, Kwapil, & Nelson-Gray, 2007b).
One of the most widely used questionnaires to assess autism is Autism-spectrum Quotient (AQ), designed by Baron Cohen et al., in 2001. Studies in the United Kingdom (Baron-Cohen, Wheelwright, Skinner, Martin, & Clubley, 2001), the Netherlands (Rosa A Hoekstra, Bartels, Cath, & Boomsma, 2008), and Japan (Wakabayashi, Baron-Cohen, Wheelwright, & Tojo, 2006) have shown that participants who are diagnosed with autism spectrum conditions (including autistic disorder and Asperger syndrome) have significantly higher scores compared with the general population.
In the original version of the AQ, every 10 items (of the 50 items) measures 1 of the 5 subdomains of communication, social skills, imagination, attention to detail, and attention switching. The internal consistency values of the original version of AQ were reported as follows: social skills, 0.77; communication, 0.65; imagination, 0.65; attention to detail, 0.63; and attention switching, 0.67 (Baron-Cohen, et al., 2001). The Japanese (Wakabayashi, Baron-Cohen, Wheelwright, & Tojo, 2006), English (5), and Dutch versions of the AQ report acceptable internal consistency and good test-retest reliability for adults. All studies have examined the psychometric properties of AQ up to now, suggesting that the AQ is a reliable questionnaire to assess the autism phenotype (Rosa A Hoekstra, Bartels, Hudziak, Van Beijsterveldt, & Boomsma, 2007).
Nejati Safa et al., assessed the properties of this questionnaire in Iran. The test-retest reliability of the questionnaire in Iran with a 3-week interval was found as 0.82. The Cronbach alpha coefficient for the internal consistency of all items was 0.76, and the total score was 0.79 (Nejati Safa, Kazemi, & Alaghband Rad, 2003). Although AQ is a good test for quantifying autism disorders, its many questions and time-consuming problems make it difficult to use. That is why Hoekstra et al. (Rosa Hoekstra et al., 2011) performed the abridged version of the Autism-Spectrum Quotient (AQ-Short) in 2011 on Dutch students.
AQ-S is a short form of AQ that includes 28 items of the 50 items. AQ items are related to the following 5 areas, which reflect the ASD phenotypes: social skills, routine, attention switching, imagination, and a fascination for numbers/patterns (Kuenssberg, Murray, Booth, & McKenzie, 2014).
Some studies mention that the AQ has been translated into multiple languages, and many structural and correlational studies have successfully used it. This reliable short-form retains the core dimensional structure of the AQ and would be beneficial to use in large scale studies, where a 50-item measure may be too lengthy (e.g. Rosa Hoekstra et al., 2011). AQ-S was valid in Hoekstra et al. study and because of its high sensitivity and specificity, it was introduced as a suitable alternative for AQ-Short Rosa Hoekstra et al.,, 2011). Different studies have examined the psychometric properties of AQ-S, supported its good validity and reliability (Hurst et al., 2007b; Kurita, Koyama, & Osada, 2005; Lau et al., 2013), and reported its relative success in capturing some core dimensions of individual differences in traits associated with ASD. But so far, the psychometric properties of AQ-Short has not been studied in Iran. The aim of the current study was to examine the psychometric properties of the AQ-Short in an Iranian sample.
2. Method
Participants
In this study, 254 students of universities in Tehran City, Iran, (131 females, and 123 males) were chosen by the cluster sampling method. The participants educating in different universities of Tehran with age ranged from 18-50 years (Mean±SD 24.5±4.2). Of them, 230 (90.5%) of the participants were single. At first, informed consent was obtained from all participants. Then, they answered demographic form questions, completed Experience in Close Relationships-Revised Questionnaire (ECR-R), AQ-S, and the Empathy Quotient-Short (EQ-S). Table 1 presents the participants’ demographic characteristics.
Study instruments
Autism Spectrum Quotient Short form (AQ-S)
Autism Spectrum Quotient Short (AQ-S) form is the 28-item version of the self-report AQ (which is a 50-item scale), assessing autistic traits (Simon Baron-Cohen, et al., 2001; Hoekstra et al., 2011). The original items were categorized into 5 subdomains measuring communication, social skills, attention to detail, imagination, and attention switching (Simon Baron-Cohen, et al., 2001). AQ-S items are assigned to 5 defined factors, which assess 1) the deficiency of social skills, 2) the preference for routine, 3) the imagination difficulties, 4) the difficulties with attention switching, and 5) the fascination for numbers/patterns (Hoekstra et al., 2011). We used the translated form of AQ for the Iranian sample (Pouretemad, Ziyayi, & Ghanjavi, 2008).
Experience in Close Relationships-Revised Questionnaire (ECR-R)
Brennan et al., designed Experience in Close Relationships-Revised (ECR-R) questionnaire in 1998 (Brennan, Clark, & Shaver, 1998). It is a self-report questionnaire consisting of 36 items and 2 subscales prepared to measure the avoidance and anxiety attachment. The participants rated each item based on a 7-point Likert-type scale from 1 (strongly oppose) to 7 (strongly agree). They reported an acceptable Cronbach alpha value for avoidance and anxiety scale. Using the test-retest method, Fraley et al. reported a reliability coefficient of 0.94 for the anxiety scale and a reliability coefficient of 0.95 for the avoidance scale (Fraley, Waller, & Brennan, 2000). Fairchild and Finney indicated that each of the anxiety and avoidance scales has good internal consistency. The Cronbach alpha coefficients were 0.917 and 0.927 for anxiety and avoidance, respectively (Fairchild & Finney, 2006). The psychometric properties of this questionnaire have not been studied in Iran so far, but in the present study, the internal consistencies were found as 0.92, 0.90, and 0.91 for the whole questionnaire, anxiety attachment, and avoidance, respectively.
Empathy Quotient-Short (EQ-S)
The Empathy Quotient-Short (EQ-S) form was designed to measure a person’s ability to relate to others’ emotions (Wakabayashi, et al., 2006). EQ-S was arranged using a sample of 1761 undergraduate students by analyzing the main components of the Baron-Cohen’s 60-item empathy scale (S. Baron-Cohen & Wheelwright, 2004). The Cronbach alpha for the current sample of EQ-S was 0.87. Earlier studies examined the psychometric properties of the EQ-S and established its validity and reliability (Dimitrijević, Hanak, Vukosavljević-Gvozden, & Opačić, 2012; Guan, Jin, & Qian, 2012; Parker, Keefer, & Wood, 2011). Dimitrijević et al., (2012). obtained the Cronbach alpha of 0.78 for this scale. The psychometric properties of this questionnaire have not been studied in Iran so far, but the Cronbach alpha coefficient in the current sample for all questions was 0.73.
Statistical analysis
Lertab software version 5.4 was used to analyze the psychometric properties. SPSS version 24 was used to analyze the exploratory factor analysis, and the LISREL software version 8.8 was used to analyze the confirmatory factor analysis. The correlation between variables was analyzed by R software. The correlation between AQ-S and ECR-R was calculated to assess convergent reliability, and the correlation between AQ-S and EQ-S was assessed to confirm divergent reliability.
Procedure
In this study, 254 students of universities in Tehran (131 females and 123 males) were chosen using the cluster sampling method following the ethical standards of the institutional and or national research committee. After explaining the study process to the participants, informed consent was obtained from all of them. Then, the questionnaires were distributed among the participants. We used the translated form of AQ, which has been translated into Persian for the Iranian sample (Pouretemad et al., 2008).
3. Results
Classical data analysis
AQ-Short has 28-item and covers 5 subdomains. The statements on a 4-point response scale ranging from “definitely agree” to “definitely disagree” are scored in a two-value scale (0.1).
In this section, based on the classical model, we measured several indices such as difficulty index (p) (correct response ratio), detection power (the biserial point index [pb (r)]), And the standard score (z) of the average estimated criterion score and has been represented in Table 2.
The encountered difficulties indicated that the participants had problems to choose the options with score 1. Moreover, the detection power of all questions except questions 19 and 26 was good. Also, the Cronbach alpha was calculated for each question. The results revealed that the questions have good validation. The Cronbach alpha coefficient for the whole scale of AQ-S, in the current sample, was 0.95, and for the subdomains were as follows: social skills, 0.92; routine, 0.48; imagination, 0.94; attention switching, 0.58; and the pattern/numbers, 0.89.
Table 3 shows the difficulty distribution of AQ-S. The difficulty sequence indicated that the difficulty of questions is between 0.00 and 0.60. Questions 18 and 21 are among the easiest questions, and question 24 is the most challenging question to answer.
Table 3 shows the difficulty distribution of AQ-S. The difficulty sequence indicated that the difficulty of questions is between 0.00 and 0.60. Questions 18 and 21 are among the easiest questions, and question 24 is the most challenging question to answer.
The detection coefficient of questions ranged between 0.2 and 0.8, which indicated their difficulty. Although they have a high level of difficulty and questions with a difficulty of 0.3 had the highest detection coefficient, the most difficult questions had a good detection coefficient. In other words, easy questions had the lowest detection coefficient (Table 4).
Table 3 shows the Z score, T score, and percentile rank of the AQ-S. The T score was calculated, using the following formula:
T score = (Z score × 10) +50
The average of T scores is 50 and the standard deviation (SD) is 10; those with an SD of more than the mean score (60) are diagnosed with autistic traits. For example, a person who scored 19 in the AQ-S has a T score of 61; thus, he or she is diagnosed as a person with autistic traits with higher than 76% of the general population in autistic traits (Table 5).
Exploratory factor analysis
For the exploratory factor analysis of the AQ-S, SPSS version 24 was used. The questions’ structure for a 28-item scale was studied through the exploratory factor analysis by principal components and Varimax rotation. In the current study, the Kaiser-Meyer-Olkin statistic was 0.89. Bartlett’s statistic with a value of 4143.65, a degree of freedom of 378, and a significance level of 0.001 confirmed this assumption, and the minimum condition for performing factor analysis was established.
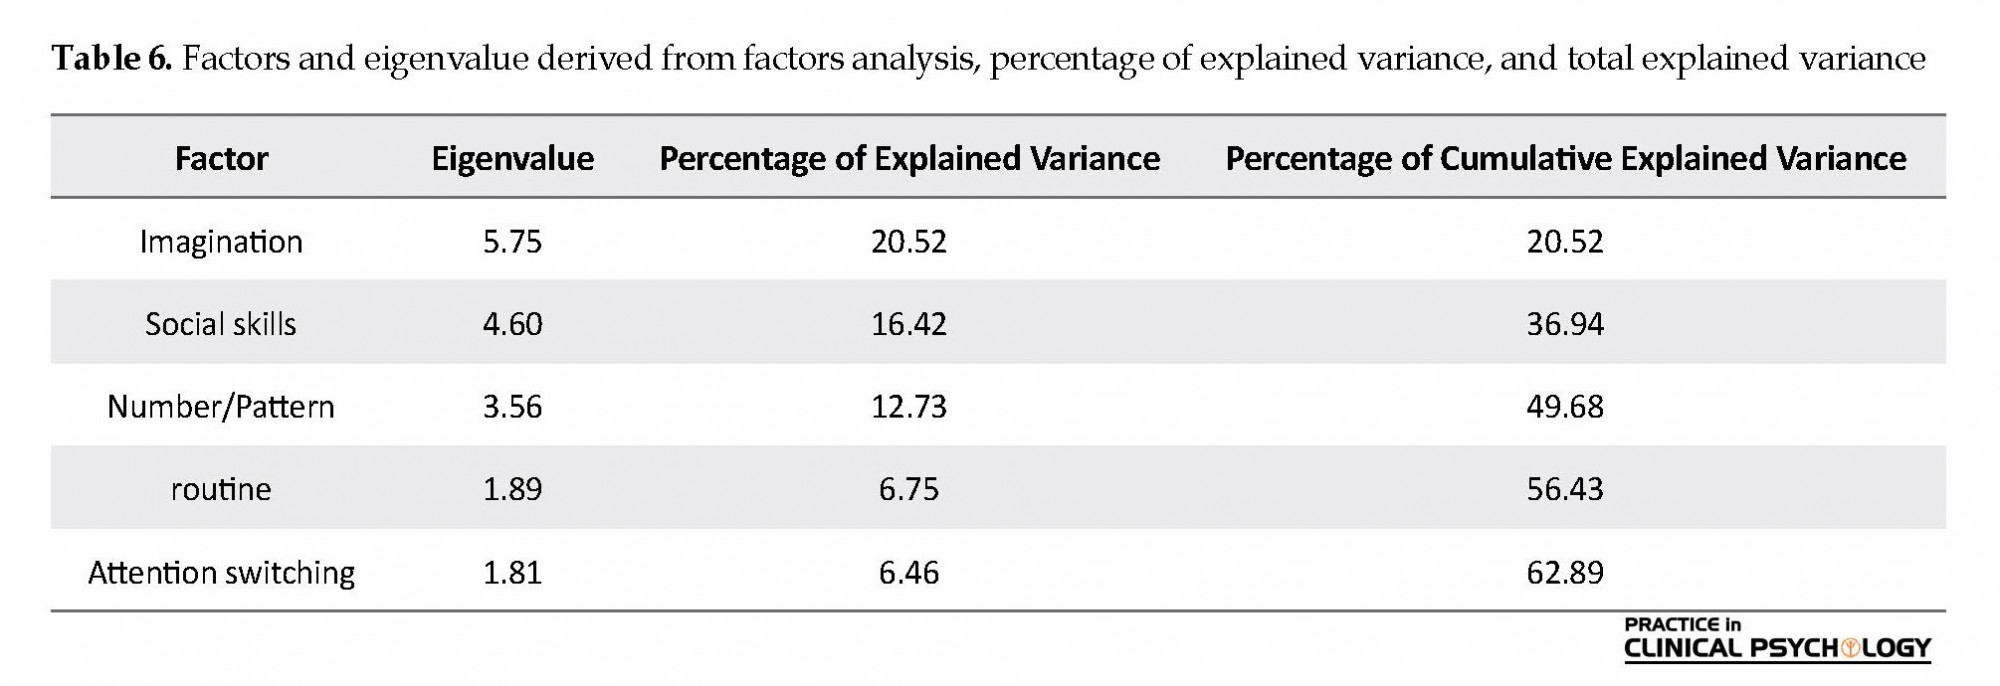
After analyzing loads of factors with the scale structure, 6 factors were extracted. Only 2 questions with a low factor loading were on the 6 factors, which is not statistically valid. As a result, in the 5-factor analysis, the factor structure was examined. At that point, the results were consistent with the same target structure and, finally, that factor structure resulted in the extraction of 5 factors, which explained 62.89% of the total scale variance (Table 4). Also, the first factor (imagination) had the highest percentage of the explained variance of 20.55%, which had an eigenvalue of 5.75. The second factor (social skills) had an eigenvalue of 4.60 and the 16.42% of explained variance, and the third factor (number/pattern) with an eigenvalue of 3.56% explained 12.73% of the total variance. Also, the fourth factor (routine) with an eigenvalue of 1.89 and a fifth factor (attention switching) with an eigenvalue of 81.1 explained 6.75% and 6.46% of the total variance, respectively (Table 6).
For the exploratory factor analysis of the AQ-S, SPSS version 24 was used. The questions’ structure for a 28-item scale was studied through the exploratory factor analysis by principal components and Varimax rotation. In the current study, the Kaiser-Meyer-Olkin statistic was 0.89. Bartlett’s statistic with a value of 4143.65, a degree of freedom of 378, and a significance level of 0.001 confirmed this assumption, and the minimum condition for performing factor analysis was established.
After analyzing loads of factors with the scale structure, 6 factors were extracted. Only 2 questions with a low factor loading were on the 6 factors, which is not statistically valid. As a result, in the 5-factor analysis, the factor structure was examined. At that point, the results were consistent with the same target structure and, finally, that factor structure resulted in the extraction of 5 factors, which explained 62.89% of the total scale variance (Table 4). Also, the first factor (imagination) had the highest percentage of the explained variance of 20.55%, which had an eigenvalue of 5.75. The second factor (social skills) had an eigenvalue of 4.60 and the 16.42% of explained variance, and the third factor (number/pattern) with an eigenvalue of 3.56% explained 12.73% of the total variance. Also, the fourth factor (routine) with an eigenvalue of 1.89 and a fifth factor (attention switching) with an eigenvalue of 81.1 explained 6.75% and 6.46% of the total variance, respectively (Table 6).
Figure 1 shows the screen plot resulting from factor analysis. The screen plot structure shows that only 5 factors can be real factors, and the other factors were not considered because of the lack of power for the explanation of the variance.
Out of 28 questions of AQ-S, 8 questions were loading on the first factor (imagination), 7 questions on the second factor (social skills), 5 questions on the third factor (number/pattern), and 4 questions on each of the fourth (routine) and fifth (attention switching) factors. Table 5 presents the loading questions of each factor considering their importance order. Also, the amount of subscription of each question to the factor is represented in the last column, indicating that the initial questions of each factor have more subscriptions, and the remaining questions have fewer subscriptions (Table 7).
Out of 28 questions of AQ-S, 8 questions were loading on the first factor (imagination), 7 questions on the second factor (social skills), 5 questions on the third factor (number/pattern), and 4 questions on each of the fourth (routine) and fifth (attention switching) factors. Table 5 presents the loading questions of each factor considering their importance order. Also, the amount of subscription of each question to the factor is represented in the last column, indicating that the initial questions of each factor have more subscriptions, and the remaining questions have fewer subscriptions (Table 7).
Confirmatory Factor Analysis
AQ-S has 28 questions and 5 subdomains of social skills (7 questions), imagination (8 questions), number/pattern (5 questions), routine (4 questions), and attention switching (4 questions).
In this section, the AQ-S was assessed using confirmatory factor analysis, and the results were reported as descriptive indices for each question, model fitting indices, and measurement models. The confirmatory factor analysis was performed by the Lisrel software version 8.8.
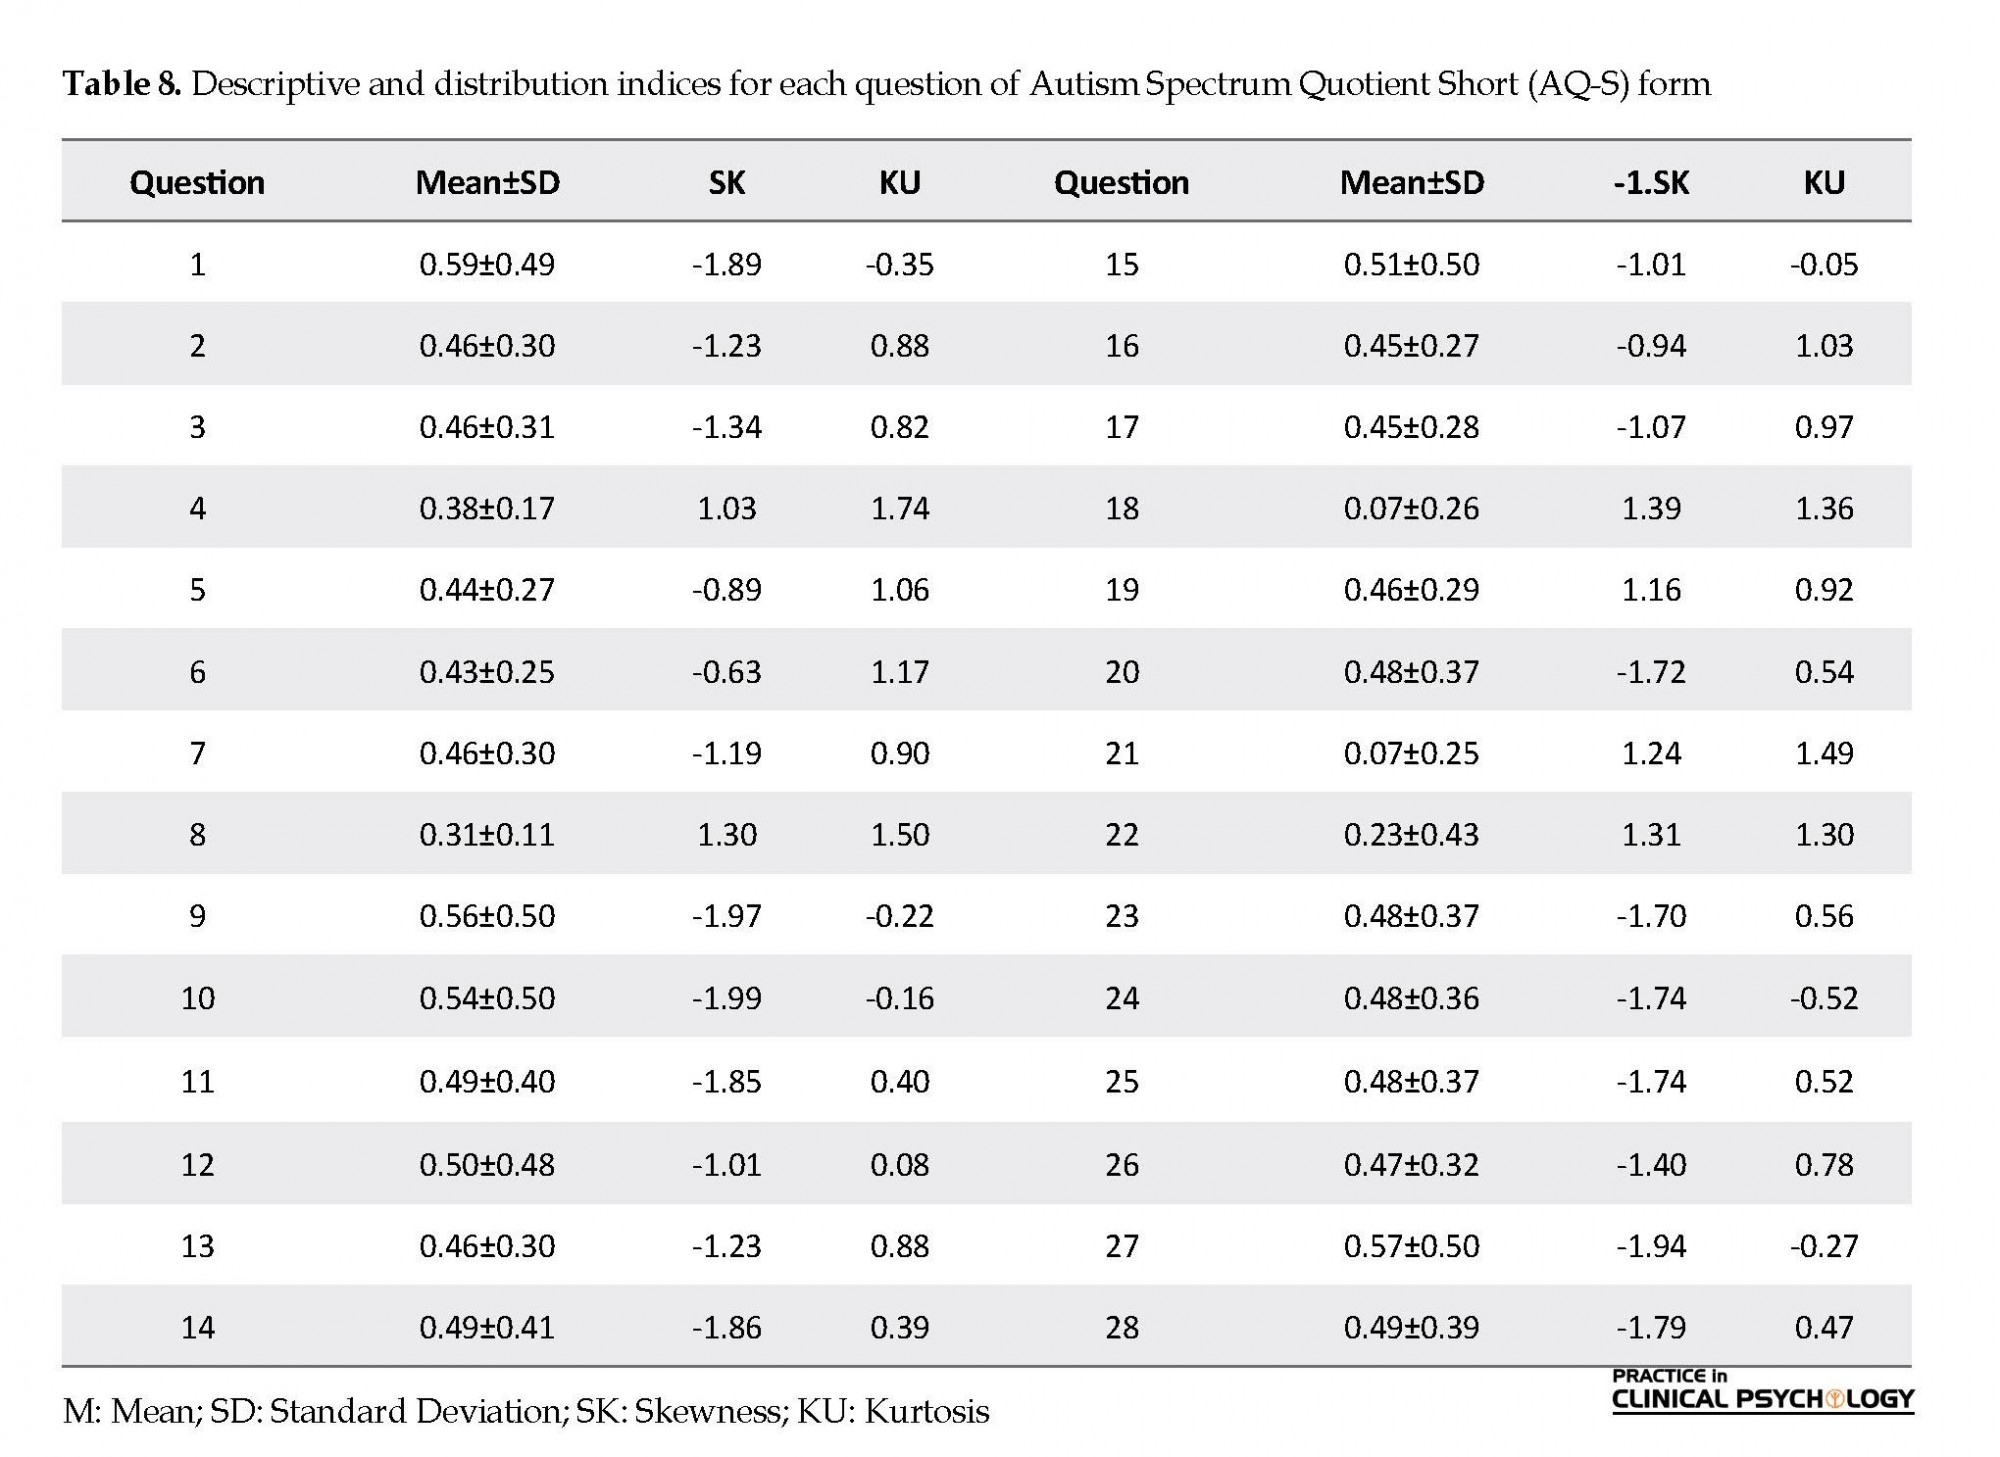
For the confirmatory factor analysis, the distribution indices of each question were examined. The data distribution indices (skewness and kurtosis) showed that the obtained value was within the conventional limit of ±1.96. So, the distribution of questions is normal (Table 8).
AQ-S has 28 questions and 5 subdomains of social skills (7 questions), imagination (8 questions), number/pattern (5 questions), routine (4 questions), and attention switching (4 questions).
In this section, the AQ-S was assessed using confirmatory factor analysis, and the results were reported as descriptive indices for each question, model fitting indices, and measurement models. The confirmatory factor analysis was performed by the Lisrel software version 8.8.
For the confirmatory factor analysis, the distribution indices of each question were examined. The data distribution indices (skewness and kurtosis) showed that the obtained value was within the conventional limit of ±1.96. So, the distribution of questions is normal (Table 8).
After analyzing the data distribution indexes, measuring model for the AQ-S subdomains was tested through confirmatory factor analysis. The abridged form of autism-spectrum quotient consists of five subdomains, including social skills, imagination, number/patterns, routine and attention switching. The results of the fitting model indexes have been indicated in Table 9. The obtained indices, including Comparative Fit Index, Root Mean Square Error of Approximation, Normed Fit Index, Incremental fit index, and Standardized Root Mean Square Residual indicate that the model is fitted with data. Also, the low goodness of fit index and adjusted goodness of fit index of the desired level appear to be because of the large sample size compared with the number of parameters entered into the measurement model because these indices are sensitive to the sample size in relation to the parameters. Regarding the optimal value for model fit indices, the Chi-square index is desirable. However, the index of the χ2 statistic for this section is significant, which shows a difference between the theoretical model covariance matrix and the covariance matrix generated by the data (Hu & Bentler, 1999; Schumacker and Lomax, 2004); while an appropriate model must have an insignificant χ2 index (Barrett, 2007). However, this index is considered badness-of-fit (Kline, 2015) or lack of fit indices (Mulaik et al., 1989). Since this level and significance of this index can be influenced by some of the features in the data, such as not meeting the multivariate normality assumption (McIntosh, Edwards, & Antonakis, 2014), the saturation rate of the model (Hu & Bentler, 1999; Schumacker & Lomax, 2004), and the sample size (Bentler & Bonett, 1980; Jöreskog & Sörbom, 1989, 1993; Kenny & McCoach, 2003) of this index is often reported as a traditional indicator, but its significance is not much considered (Hooper, Coughlan, & Mullen, 2008).
Figure 2 shows the measurement model of each question on the subdomains of AQ-S. In Figure 2, AQ-S is illustrated with “Social S” rather than social skills, “Routine” for routine, “Imagination” rather than imagination, “Switching” rather than attention switching, and “Num Pat” rather than number/pattern. The standard coefficients for most of the questions are over 0.65, and only questions 18, 19, 21, and 26 have lower standard coefficients. Questions 13, 14, 15, 20, and 28 are the best questions. If the amount of the t value is less than 1.96, it is not significant. The amount between 1.96 and 3 shows that the regression coefficient is significant at the 95% level and t values, which are greater than 3, are significant at the 99% level. The results of the t value indicate that this value is greater than 3 for all questions. So, this value is significant at the 99% level.
Divergent and convergent reliability
The correlation was used to assess divergent and convergent reliability. As presented in table 10, there was a significant negative correlation between the components of AQ-S with EQ-S, indicating that divergent reliability is approved for this scale. Also, we used the ECR-R to assess the convergent reliability of AQ-S. There was a positive correlation between the components of AQ-S and anxiety and avoidant attachment, which was significant at the 0.001 level. Thus, convergent reliability is also shown for AQ-S.
The correlation was used to assess divergent and convergent reliability. As presented in table 10, there was a significant negative correlation between the components of AQ-S with EQ-S, indicating that divergent reliability is approved for this scale. Also, we used the ECR-R to assess the convergent reliability of AQ-S. There was a positive correlation between the components of AQ-S and anxiety and avoidant attachment, which was significant at the 0.001 level. Thus, convergent reliability is also shown for AQ-S.
4. Discussion
The reliability and validity of AQ-S were studied in a sample of university students. The results indicated that AQ-S has good validity among students. To evaluate the internal consistency of AQ-S, the Cronbach alpha coefficient was calculated. The Cronbach alpha coefficients for social skills, routine, imagination, attention switching, and pattern/number components were 0.92, 0.48, 0.49, 0.58, and 0.89, respectively, and for the whole scale was 0.95. The results suggest that this scale has good validity and can be used to measure autistic traits. The low Cronbach alpha values for routine and attention switching components may be because of a few questions devoted to measuring them. This result is consistent with previous research findings (Hurst, Mitchell, Kimbrel, Kwapil, & Nelson-Gray, 2007a; Kurita et al., 2005; Lau et al., 2013). Also, there were significant sex differences in routine, imagination, attention switching, and pattern/number components, which were consistent with findings by Hoekstra et al. (Hoekstra et al., 2011).
The reliability and validity of AQ-S were studied in a sample of university students. The results indicated that AQ-S has good validity among students. To evaluate the internal consistency of AQ-S, the Cronbach alpha coefficient was calculated. The Cronbach alpha coefficients for social skills, routine, imagination, attention switching, and pattern/number components were 0.92, 0.48, 0.49, 0.58, and 0.89, respectively, and for the whole scale was 0.95. The results suggest that this scale has good validity and can be used to measure autistic traits. The low Cronbach alpha values for routine and attention switching components may be because of a few questions devoted to measuring them. This result is consistent with previous research findings (Hurst, Mitchell, Kimbrel, Kwapil, & Nelson-Gray, 2007a; Kurita et al., 2005; Lau et al., 2013). Also, there were significant sex differences in routine, imagination, attention switching, and pattern/number components, which were consistent with findings by Hoekstra et al. (Hoekstra et al., 2011).
Evaluating difficulty coefficients indicated that choosing options with score 1 is more difficult than others. Also, questions had a good detection coefficient except questions 19 and 26 that measure the routine component. To determine the number of factors forming AQ-S, exploratory factor analysis was performed. The principal components analysis was used to extract factors. The results indicated that the AQ-S is a 5-factor structure. Exploratory factor analysis showed that the first 5 factors could explain 62.89% of the total variance of the AQ. Also, the results of the confirmatory factor analysis confirmed the fitness of the 5-factor model.
EQ-S was used to assess divergent reliability. EQ-S was chosen since research has shown a negative and significant relationship between autistic traits and empathy. This means that with increasing autistic traits, empathy decreases and vice versa (Simon Baron-Cohen, O’Riordan, Jones, Stone, & Plaisted, 1999; Baron-Cohen, 2001; Baron‐Cohen, Jolliffe, Mortimore, & Robertson, 1997). The autistic traits have a significant negative relationship with cognitive empathy (Mazza et al., 2014; Rueda, Fernández-Berrocal, & Schonert-Reichl, 2014) and affective empathy (Pfabigan et al., 2015; Rueda et al., 2014). Social motivation theory represents that people with ASD have a deficit in social motivation that prevents them from developing strong empathy skills since they are not exposed to conditions that require appropriate empathy (Chevallier, Kohls, Troiani, Brodkin, & Schultz, 2012). On the other hand, people with ASD or autistic traits reported higher levels of personal distress and less and unsuccessful use of emotion regulation strategies such as reappraisal compared with the normal people (Samson, Huber, & Gross, 2012). These individuals may use repression more as an emotion regulation strategy, which is associated with low positive emotions and more negative emotions (Gross & John, 2003). Also, several studies (Castelli, Frith, Happé, & Frith, 2002; Kaland et al., 2002) that have investigated perspective-taking deficit, as a component of empathy, have found that people with autistic traits have some deficiencies in this empathy component. Therefore, we assessed the correlation between AQ-S and empathy quotient.
Furthermore, the correlation between AQ-S and ECR-R was assessed for approving convergent reliability because various researchers have argued that the AQ scale measures personality traits associated with avoidance and anxiety attachment (Turner, 2015). Avoiding behaviors are associated with a fear of intimacy and potential distrust of a partner in close relationships. Similarly, people with an avoidant attachment emphasize independence and self-reliance (Rutgers, Bakermans‐Kranenburg, van Ijzendoorn, & van Berckelaer‐Onnes, 2004). On the other hand, such a tendency for self-reliance and independence in close relationships may represent a coping strategy for individuals with higher levels of autistic traits. Therefore, they may learn these behaviors to deal with emotional distress caused by the awareness of the lack of interpersonal skills and social understanding in themselves (White & Roberson-Nay, 2009). This means that people with autistic traits may receive more encouragement to avoid situations.
Anxiety attachment is likely to cause personal distress in relationships with others. Avoiding behaviors that can occur in individuals with avoidance attachment are likely to lead to poor social skills in relationships, which may appear as autistic behaviors. Thus, AQ and ECR-R may measure a common fundamental structure (Davis, 1983). Also, standard scores for AQ-S have been reported. The quotient’s scores are between 0 and 28, and if someone scores more than 19, he or she will be diagnosed with autistic traits. The aim of this study was not to replace the full-scale AQ, and like its original version, it can be used as an instrument to measure autistic traits in a non-clinical sample and large-scale studies.
The results of the current study were based on a sample of university students, who were satisfied with the research and filled the questionnaires. Thus, the generalization of the results to populations outside this domain can be questionable. Besides, the results were based on self-reports and may be mistaken because of the participants’ subjective views of themselves and how they relate to others. It is also suggested to perform this questionnaire in a clinical sample of people with autistic spectrum disorders.
In conclusion, AQ is an innovative and essential first step to identify adults with autistic traits. The findings of this study confirm that the 28-item Iranian AQ has good reliability and validity. It comprises items corresponding to the diagnostic criteria of ASD and can be therapeutically informative. It is resistant to cultural differences, and last but not the least, its use in non-clinical and community settings is quick, easy, and economical.
Ethical Considerations
Compliance with ethical guidelines
All procedures performed in studies involving human participants were following the ethical standards of the institutional and or national research committee (The Ethics Committee of Shahid Beheshti University of Medical Science with the reference number of IR.SBMU.MSP.REC.1396.693) and the Declaration of Helsinki 1964 and its later amendments or comparable ethical standards.
Funding
This research did not receive any specific grant from funding agencies in the public, commercial, or not-for-profit sectors.
Authors' contributions
All authors equally contributed to design and conduct the research and write the manuscript.
Conflict of interest
The authors declared no conflict of interest.
References
American Psychiatric Association. (2013). Diagnostic and Statistical Manual of mental disorders (DSM-5®). Washington, DC: American Psychiatric Pub.
Baron-Cohen, S., & Wheelwright, S. (2004). The empathy quotient: An investigation of adults with Asperger syndrome or high functioning autism, and normal sex differences. Journal of Autism and Developmental Disorders, 34(2), 163-75. [DOI:10.1023/B:JADD.0000022607.19833.00] [PMID]
Baron‐Cohen, S., Jolliffe, T., Mortimore, C., & Robertson, M. (1997). Another advanced test of theory of mind: Evidence from very high functioning adults with autism or Asperger syndrome. Journal of Child Psychology and Psychiatry, 38(7), 813-22. [DOI:10.1111/j.1469-7610.1997.tb01599.x] [PMID]
Baron-Cohen, S., O’Riordan, M., Jones, R., Stone, V., & Plaisted, K. (1999). A new test of social sensitivity: Detection of faux pas in normal children and children with Asperger syndrome. Journal of Autism and Developmental Disorders, 29(5), 407-18. [DOI:10.1023/A:1023035012436] [PMID]
Baron-Cohen, S., Wheelwright, S., Skinner, R., Martin, J., & Clubley, E. (2001). The Autism-spectrum Quotient (AQ): Evidence from Asperger syndrome/high-functioning autism, males and females, scientists and mathematicians. Journal of Autism and Developmental Disorders, 31(1), 5-17. [DOI:10.1023/A:1005653411471] [PMID]
Baron-Cohen, S., Wheelwright, S., Spong, A., Scahill, V., & Lawson, J. (2001). Are intuitive physics and intuitive psychology independent? A test with children with Asperger syndrome. Journal of Developmental and Learning Disorders, 5, 47-78.
Barrett, P. (2007). Structural equation modelling: Adjudging model fit. Personality and Individual Differences, 42(5), 815-24. [DOI:10.1016/j.paid.2006.09.018]
Baxter, A. J., Brugha, T. S., Erskine, H. E., Scheurer, R. W., Vos, T., & Scott, J. G. (2015). The epidemiology and global burden of autism spectrum disorders. Psychological Medicine, 45(3), 601-13. [DOI:10.1017/S003329171400172X] [PMID]
Bentler, P. M., & Bonett, D. G. (1980). Significance tests and goodness of fit in the analysis of covariance structures. Psychological Bulletin, 88(3), 588-606. [DOI:10.1037/0033-2909.88.3.588]
Brennan, K. A., Clark, C. L., & Shaver, P. R. (1998). Self-report measurement of adult attachment: An integrative overview. In J. A. Simpson & W. S. Rholes (Eds.), Attachment theory and close relationships (pp. 46-76). New York: Guilford Press.
Castelli, F., Frith, C., Happé, F., & Frith, U. (2002). Autism, Asperger syndrome and brain mechanisms for the attribution of mental states to animated shapes. Brain, 125(8), 1839-49. [DOI:10.1093/brain/awf189] [PMID]
Chevallier, C., Kohls, G., Troiani, V., Brodkin, E. S., & Schultz, R. T. (2012). The social motivation theory of autism. Trends in Cognitive Sciences, 16(4), 231-9. [DOI:10.1016/j.tics.2012.02.007] [PMID] [PMCID]
Constantino, J. N., & Todd, R. D. (2003). Autistic traits in the general population: A twin study. Archives of General Psychiatry, 60(5), 524-30. [DOI:10.1001/archpsyc.60.5.524] [PMID]
Davis, M. H. (1983). Measuring individual differences in empathy: Evidence for a multidimensional approach. Journal of Personality and Social Psychology, 44(1), 113-26. [DOI:10.1037/0022-3514.44.1.113]
Dimitrijević, A., Hanak, N., Vukosavljević-Gvozden, T., & Opačić, G. (2012). Psychometric properties of the Serbian version of the Empathy Quotient (S-EQ). Psihologija, 45(3), 257-76. [DOI:10.2298/PSI1203257D]
Fairchild, A. J., & Finney, S. J. (2006). Investigating validity evidence for the experiences in close relationships-revised questionnaire. Educational and Psychological Measurement, 66(1), 116-35. [DOI:10.1177/0013164405278564]
Fraley, R. C., Waller, N. G., & Brennan, K. A. (2000). An item response theory analysis of self-report measures of adult attachment. Journal of Personality and Social Psychology, 78(2), 350-65. [DOI:10.1037/0022-3514.78.2.350] [PMID]
Gross, J. J., & John, O. P. (2003). Individual differences in two emotion regulation processes: Implications for affect, relationships, and well-being. Journal of Personality and Social Psychology, 85(2), 348-62. [DOI:10.1037/0022-3514.85.2.348] [PMID]
Guan, R., Jin, L., & Qian, M. (2012). Validation of the empathy quotient-short form among Chinese healthcare professionals. Social Behavior and Personality: An International Journal, 40(1), 75-84. [DOI:10.2224/sbp.2012.40.1.75]
Hoekstra, R. A., Bartels, M., Cath, D. C., & Boomsma, D. I. (2008). Factor structure, reliability and criterion validity of the Autism-spectrum Quotient (AQ): A study in Dutch population and patient groups. Journal of Autism and Developmental Disorders, 38(8), 1555-66. [DOI:10.1007/s10803-008-0538-x] [PMID] [PMCID]
Hoekstra, R. A., Bartels, M., Hudziak, J. J., Van Beijsterveldt, T. C., & Boomsma, D. I. (2007). Genetic and environmental covariation between autistic traits and behavioral problems. Twin Research and Human Genetics, 10(6), 853-60. [DOI:10.1375/twin.10.6.853] [PMID]
Hoekstra, R. A., Bartels, M., Verweij, C. J., & Boomsma, D. I. (2007). Heritability of autistic traits in the general population. Archives of Pediatrics & Adolescent Medicine, 161(4), 372-7. [DOI:10.1001/archpedi.161.4.372] [PMID]
Hoekstra, R. A., Vinkhuyzen, A. A., Wheelwright, S., Bartels, M., Boomsma, D. I., & Baron-Cohen, S., et al. (2011). The construction and validation of an abridged version of the Autism-spectrum Quotient (AQ-Short). Journal of autism and developmental disorders, 41(5), 589-96. [DOI:10.1007/s10803-010-1073-0] [PMID] [PMCID]
Hooper, D., Coughlan, J., & Mullen, M. R. (2008). Structural equation modelling: Guidelines for determining model fit. Electronic Journal of Business Research Methods, 6(1), 53-60.
Hu, L. t., & Bentler, P. M. (1999). Cutoff criteria for fit indexes in covariance structure analysis: Conventional criteria versus new alternatives. Structural Equation Modeling: A Multidisciplinary Journal, 6(1), 1-55. [DOI:10.1080/10705519909540118]
Hurley, R. S., Losh, M., Parlier, M., Reznick, J. S., & Piven, J. (2007). The broad autism phenotype questionnaire. Journal of Autism and Developmental Disorders, 37(9), 1679-90. [DOI:10.1007/s10803-006-0299-3] [PMID]
Hurst, R., Mitchell, J., Kimbrel, N., Kwapil, T., & Nelson-Gray, R. (2007). Examination of the reliability and factor structure of the Autism spectrum Quotient (AQ) in a non-clinical sample. Personality and Individual Differences, 43(7), 1938-49. [DOI:10.1016/j.paid.2007.06.012]
Jöreskog, K. G., & Sörbom, D. (1989). LISREL 7: A guide to the program and applications. Chicago: SPSS Inc.
Jöreskog, K. G., & Sörbom, D. (1993). LISREL 8: Structural equation modeling with the SIMPLIS command language. Lincolnwood, IL: Scientific Software International.
Kaland, N., Møller‐Nielsen, A., Callesen, K., Mortensen, E. L., Gottlieb, D., & Smith, L. (2002). A new ‘advanced’ test of theory of mind: Evidence from children and adolescents with Asperger syndrome. Journal of Child Psychology and Psychiatry, 43(4), 517-28. [DOI:10.1111/1469-7610.00042] [PMID]
Kanner, L., & Eisenberg, L. (1957). Early infantile autism, 1943-1955. Psychiatric Research Reports, 7, 55-65. [DOI:10.4159/harvard.9780674367012.c2] [PMID]
Kenny, D. A., & McCoach, D. B. (2003). Effect of the number of variables on measures of fit in structural equation modeling. Structural Equation Modeling, 10(3), 333-51. [DOI:10.1207/S15328007SEM1003_1]
Kline, R. B. (2015). Principles and practice of structural equation modeling. New York: Guilford Press.
Kurita, H., Koyama, T., & Osada, H. (2005). Autism‐Spectrum Quotient-Japanese version and its short forms for screening normally intelligent persons with pervasive developmental disorders. Psychiatry and Clinical Neurosciences, 59(4), 490-6. [DOI:10.1111/j.1440-1819.2005.01403.x] [PMID]
Kuenssberg, R., Murray, A. L., Booth, T., & McKenzie, K. (2014). Structural validation of the abridged Autism Spectrum Quotient–Short Form in a clinical sample of people with autism spectrum disorders. Autism, 18(2), 69-75.
Lau, W. Y. P., Gau, S. S. F., Chiu, Y. N., Wu, Y. Y., Chou, W. J., & Liu, S. K., et al. (2013). Psychometric properties of the Chinese version of the Autism Spectrum Quotient (AQ). Research in Developmental Disabilities, 34(1), 294-305. [DOI:10.1016/j.ridd.2012.08.005] [PMID]
Mazza, M., Pino, M. C., Mariano, M., Tempesta, D., Ferrara, M., & De Berardis, D., et al. (2014). Affective and cognitive empathy in adolescents with autism spectrum disorder. Frontiers in Human Neuroscience, 8, 791. [DOI:10.3389/fnhum.2014.00791] [PMID] [PMCID]
McIntosh, C. N., Edwards, J. R., & Antonakis, J. (2014). Reflections on partial least squares path modeling. Organizational Research Methods, 17(2), 210-51. [DOI:10.1177/1094428114529165]
Mulaik, S. A., James, L. R., Van Alstine, J., Bennett, N., Lind, S., & Stilwell, C. D. (1989). Evaluation of goodness-of-fit indices for structural equation models. Psychological Bulletin, 105(3), 430-45. [DOI:10.1037/0033-2909.105.3.430]
Nejati Safa, A. A., Kazemi, M. R., & Alaghband Rad, J. (2003). [Autistic features in adult population: Evidence for continuity of autistic symptoms with normality (Persian)]. Advances in Cognitive Sciences, 5(3), 34-9.
Parker, J. D., Keefer, K. V., & Wood, L. M. (2011). Toward a brief multidimensional assessment of emotional intelligence: Psychometric properties of the Emotional Quotient Inventory-Short Form. Psychological Assessment, 23(3), 762-77. [DOI:10.1037/a0023289] [PMID]
Pfabigan, D. M., Seidel, E. M., Wucherer, A. M., Keckeis, K., Derntl, B., & Lamm, C. (2015). Affective empathy differs in male violent offenders with high-and low-trait psychopathy. Journal of Personality Disorders, 29(1), 42-61. [DOI:10.1521/pedi_2014_28_145] [PMID]
Pouretemad, H. R., Ziaei, M., & Ganjavi, A. (2009). [The Autism-Spectrum Quotient- Persian version, 2009: Adult AQ-P (16+ years) (Persian)]. Retrieved from http://ctad.ir/wp-content/uploads/2018/04/16-ctad.ir_.pdf
Robinson, E. B., Koenen, K. C., McCormick, M. C., Munir, K., Hallett, V., & Happé, F., et al. (2011). Evidence that autistic traits show the same etiology in the general population and at the quantitative extremes (5%, 2.5%, and 1%). Archives of General Psychiatry, 68(11), 1113-21. [DOI:10.1001/archgenpsychiatry.2011.119] [PMID] [PMCID]
Rueda, P., Fernández-Berrocal, P., & Schonert-Reichl, K. A. (2014). Empathic abilities and theory of mind in adolescents with Asperger syndrome: Insights from the twenty-first century. Review Journal of Autism and Developmental Disorders, 1(4), 327-43. [DOI:10.1007/s40489-014-0026-5]
Rutgers, A. H., Bakermans‐Kranenburg, M. J., van Ijzendoorn, M. H., & van Berckelaer‐Onnes, I. A. (2004). Autism and attachment: A meta‐analytic review. Journal of Child Psychology and Psychiatry, 45(6), 1123-34. [DOI:10.1111/j.1469-7610.2004.t01-1-00305.x] [PMID]
Samson, A. C., Huber, O., & Gross, J. J. (2012). Emotion regulation in Asperger’s syndrome and high-functioning autism. Emotion, 12(4), 659-65. [DOI:10.1037/a0027975] [PMID]
Schumacker, R. E., & Lomax, R. G. (2004). A beginner’s guide to structural equation modeling. New York: Psychology Press. [DOI:10.4324/9781410610904]
Sucksmith, E., Roth, I., & Hoekstra, R. A. (2011). Autistic traits below the clinical threshold: Re-examining the broader autism phenotype in the 21st century. Neuropsychology Review, 21(4), 360-89. [DOI:10.1007/s11065-011-9183-9] [PMID]
Turner, T. (2015). Offending in individuals with autistic spectrum disorder: A study of risk and need [PhD. dissertation]. Birmingham, UK: University of Birmingham.
Wakabayashi, A., Baron-Cohen, S., Wheelwright, S., & Tojo, Y. (2006). The Autism-spectrum Quotient (AQ) in Japan: A cross-cultural comparison. Journal of Autism and Developmental Disorders, 36(2), 263-70. [DOI:10.1007/s10803-005-0061-2] [PMID]
Wakabayashi, A., Baron-Cohen, S., Wheelwright, S., Goldenfeld, N., Delaney, J., & Fine, D., et al. (2006). Development of short forms of the Empathy Quotient (EQ-Short) and the Systemizing Quotient (SQ-Short). Personality and Individual Differences, 41(5), 929-40. [DOI:10.1016/j.paid.2006.03.017]
White, S. W., & Roberson-Nay, R. (2009). Anxiety, social deficits, and loneliness in youth with autism spectrum disorders. Journal of Autism and Developmental Disorders, 39(7), 1006-13. [DOI:10.1007/s10803-009-0713-8] [PMID]
Type of Study: Research |
Subject:
Psychometric
Received: 2019/04/5 | Accepted: 2019/08/13 | Published: 2019/10/1
Received: 2019/04/5 | Accepted: 2019/08/13 | Published: 2019/10/1
| Rights and permissions | |
 |
This work is licensed under a Creative Commons Attribution-NonCommercial 4.0 International License. |
Practice in Clinical Psychology (PCP)
University of Social Welfare and Rehabilitation Sciences, Koodakyar Alley, Daneshjoo Blv., Evin, Tehran, Iran
Journal Tel: +9821 71732826
Publisher Tel: +9821 4535 5555 , 4535 5000
Website: http://jpcp.uswr.ac.ir
Email: iranianjcp@gmail.com